Market Analysis
110 likes | 125 Vues
Requesting $150,000 for facilities, workstations, operations, salaries. Detroit location selected for low rent cost. Investing in tools, workstations, and office supplies. Assumptions include sales growth rate.

Market Analysis
E N D
Presentation Transcript
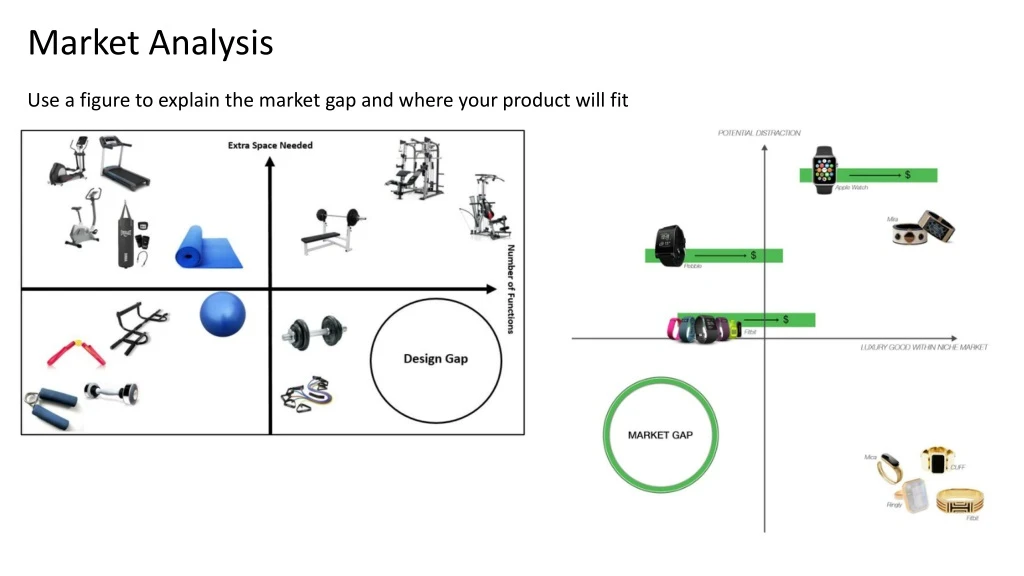
Market Analysis Use a figure to explain the market gap and where your product will fit
Capital and personnel resources Determine an investment that will allow you to have a positive cash flow Example: We are asking for an investment of $150,000. This amount will cover startup costs of facilities, workstations, and operation as well as minimal salaries for our employees during year zero when we will not be making any products. The exact distribution of this investment can be seen in our pro forma income and profit projections in the Financial Data section of this report. In year zero, we will acquire a studio space in Detroit, Michigan which will serve as the main office and Iros assembly space. Detroit was chosen because of its low rent cost as well as the many industrial resources in neighboring areas. Another portion of the investment would go towards purchasing all the necessary tools, workstations, office supplies, and any other equipment that is needed for our business. We will not be making any products in year zero and will not need to hire assembly workers, however, some money will have to go into testing manufacturing processes, marketing, income for ourselves, and worker training at the end of the year.
List your assumptions Example The following assumptions were made in our investment analyses: First year sale at 30,000 units (2% of target market) Sales growth rate as 10% (comparable to Corning, Inc & Helen of Troy Ltd.) Same number of employees for five years with unchanged salary Accounting for a 25% distributor markup Present value discount rate of 6%
Market size estimation Example 2 We assume that investors will contribute $150,000 in year zero. In order to calculate the assembly cost per part, we assume that it takes one minute for each worker (there are 4 workers) to assemble their step of the mechanism. In order to define our market size and how many products we will be able to sell, we started by finding that there are 1326 million working parents in the US with children under 18 years old. Furthermore, from our customer surveys, we found the 26% of working parents found it moderately to extremely unacceptable to check their phone at work. This immediately reduced our market size to approximately 6 million potential customers. We then assumed a very conservative 0.25% market penetration which reduced our market size down to 15,000 consumers. Based on our conjoint optimization for profit, 72% of these 15,000 consumers will buy IROS and therefore we conclude that 10,000 units will be sold in year one.
Market size estimation Example 3 Market Size. We estimate the size of total available market for VORS by calculating the total number of marine fishing boats in small-scale catch fisheries. This includes fishing boats with onboard or inboard motor engines without available electricity onboard, between 0 and 10 GT. We estimated that 0-5 GT boats would need 1 VORS unit, and boats larger than 5 GT would need an average of 2 VORS units. By including only the Indonesian and Indian markets …, we estimated a total available market size for 794,784 units. This covers about 2.6 million Indonesian and 2.1 million Indian small-scale fishermen… Market Share. Thorough research on target populations and competitive landscape predicted VORS to gain control of 22.63% of onboard cooling system product market for small-scale marine fisheries in Indonesia and India, … The market share estimate is produced by combining the following assumptions to form the target consumer group: (1) small-scale fishermen who do not have electric fridge onboard, (2) fishermen who are suffering from a significant income loss of more than 25% of their current net income (92.30%), (3) fishermen who express that they are “very likely” or “extremely likely” to purchase VORS (50.94%), and (4) VORS’ potential market share relative to other non-electric fridges based on conjoint study (95.06%).
Illustrations Video: https://www.youtube.com/watch?v=pcQQPiPC_ks