Data: Measures of Central Tendencies
180 likes | 401 Vues
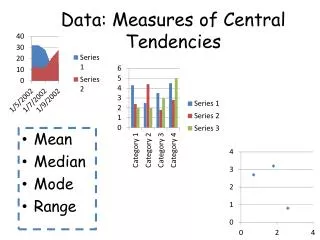
Data: Measures of Central Tendencies. Mean Median Mode Range. Using linker cubes, make a bar graph to represent the price of the toys below. Car $5. Doll $12. Game $7. Football $8. Jump Ropes $3. Top $1. Doll $12. Football $8. Game $7. Car $5. Jump Ropes $3. Top $1.

Data: Measures of Central Tendencies
E N D
Presentation Transcript
Data: Measures of Central Tendencies • Mean • Median • Mode • Range
Using linker cubes, make a bar graph to represent the price of the toys below. Car $5 Doll $12 Game $7 Football $8 Jump Ropes $3 Top $1
Doll $12 Football $8 Game $7 Car $5 Jump Ropes $3 Top $1 Leveling the Bars
Mean Leveling Calculation Doll $12 Football $8 Game $7 Car $5 Jump Ropes $3 Top $1
Doll $12 Football $8 Game $7 Car $5 Jump Ropes $3 Top $1 How do we find Median? Median: The middle value in an ordered set of data, or the mean of the two middle numbers
Doll $12 Football $8 Game $7 Car $5 Jump Ropes $3 Top $1 How do we create an ordered set?
How do we find Median? Median: The middle value in an ordered set of data, or the mean of the two middle numbers Doll $12 Median = ? 6 Football $8 Game $7 Car $5 Jump Ropes $3 Top $1
Mode What is the mode? NO MODE $5 Doll $12 Football $8 Game $7 Marbles $5 Car $5 Jump Ropes $3 Top $1
Range What is the range? The difference in the highest and the lowest values. Doll $12 Football $8 Game $7 Car $5 Jump Ropes $3 Top $1
Top $1 Range What is the range? The difference in the highest and the lowest values. Doll $12 Difference (Range) = 11
Circle Graphs Circle Graphs Circle Graphs
A child received money as a gift from grandparents. The money was used to buy one of each of these toys. Use linker cubes to make a bar graph, letting a different color represent the cost of each toy. Doll $12 Car $5 Game $7 Football $8 Jump Rope $3 Top $1
Doll $12 Football $8 Game $7 Car $5 Jump Ropes $3 Top $1 Which one costs the most?_________The least? _________ At this point, is it easy to see the percent of the total money that each toy represents? _______ What does PERCENT mean? ________________
Doll $12 Jump Ropes $3 Car $5 Game $7 Top $1 Football $8 Put all the stacks into one long tower. Transfer this representation to graph paper and color in the blocks.
What kind of graph shows things in percentages? Cut out the strip of colored graph paper. Circle it around and tape the ends together. Do NOT overlap the ends! Put this on top of a piece of dot paper. Make sure the center of the circle is exactly on one of the cross bars. Put a bold dot at the center. Draw off the sections for each color.
Identify on the graph, each toy’s fractional part of the total cost. Identify the degreee of each section. State the percent of the total cost for each toy. 8/36 = 2/9 80o 22.2%