Modeling Vibrating Beam
Modeling Vibrating Beam. -using the harmonic Oscillator equation verses collected data. Initial Data Collected (unmodified). -Our initial data collected started with a “zeroing out area”. First Attempt to Model Data. What went wrong with this attempt? . First Attempt Cont.

Modeling Vibrating Beam
E N D
Presentation Transcript
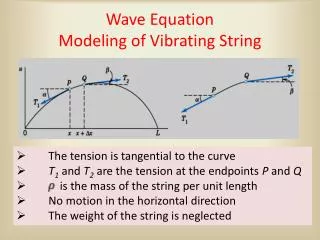
Modeling Vibrating Beam -using the harmonic Oscillator equation verses collected data
Initial Data Collected (unmodified) -Our initial data collected started with a “zeroing out area”
First Attempt to Model Data What went wrong with this attempt?
First Attempt Cont. • Used fminsearch with initial conditions on C0=1 and K0=2 resulted in C=-.1163 and K=-4.4527 • How can we improve on this model? • Take out the zeroing out area. • Shift graph to time=0. • Rerun fminsearch.
Rerunning fminsearch • CO=1 K0=2 cost=6.3941x10^-7 • C= -.67926355551960 • K= -1.5227892111787423x10^3 • But are these initial conditions the best ones to estimate C and K?
Finding better estimates of C and K • Rewrite code with double ‘for’ loops to check initial conditions between -5 and 5 for both C0 and K0 • Stored CO and KO conditions with cost values into a matrix. • This program ran overnight and did not finish in time. • Checked the resulting (and incomplete) data for the smallest cost.
The Better C and K • We were able to look at 633 additional different initial C0 and K0 conditions. • Found C0 = -5 and K0=-2.41 to have a lower cost of 6.3875x10^-7. • This cost is lower than for C0=1 and K0=2 so we used the resulting C and K of… • C = -0.68407341326426 • K =-1.522633494063630x10^3
Determine Standard Error and Confidence Intervals for C and K Using the least squares method, we were able to determine the confidence interval of both C and K. • Model fitted: • d^2 y / dt^2 = - C dy/dt - K y • n = 5019 • C = -0.68407341 • s.e.= 0.00979855 • 95 perc. ci : ( -0.70367051, -0.66447632 ) • K = -1522.633494 • s.e.(K hat) = 0.383006 • 95 perc. ci : ( -1523.399506, -1521.867482 ) • sigma^2 = 1.2666e-010
What do our estimates tell us? We can see that a harmonic oscillator model fits this data somewhat.
A closer look By taking a closer look, we can see that there are many discrepancies that our model does not account for.
Looking at the differences • The residuals gives us the difference between our data and the values estimated by the model. • From the stats.m program that we were given, we have a graph of the residuals vs. time, and residuals vs. fitted data.
Residuals vs. Fitted Value Ideally we expect this plot to be bounded in a region of residual values and have a cloud-like spread. We’re looking for a constant variance of the error terms.
Residual vs. Time This plot of residual vs. time is used to check independence and non-independence. Here is we see that the error terms are non-independent.
Sample Data vs. Standard Normal If this were a normal distribution, then our sample data would agree with the standard normal line. We see that it only follows the normal line for awhile and the tails do not.
Deviation From Normal Distribution Since there is a deviation from the normal distribution, we see the tails at the ends of the above red line.
So what could we do better? • A final technique to better model our data was introduced to our group by Professor Smith as the beam model. • To look at this, we examined his data and his beam model which provided a “best fit.”
A Closer Look Notice here with this other data set that multiple nodes are captured by the model.
Summary • This analysis took multiple steps in which careful examination is needed to better improve our models. • By taking into consideration other variables, we should be able to better model our own data using the beam model program.