Download
1 / 3
30 likes | 137 Vues
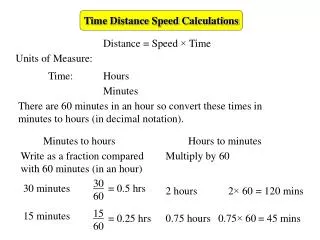
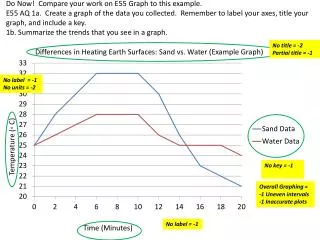
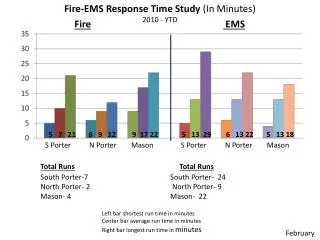
This study examines the response times of Fire and EMS services in Porter and Mason from February 2010 to YTD 2021. It provides an insightful look at average, shortest, and longest response times in minutes, highlighting trends in emergency service efficiency across different areas. Through comparative analysis of data from South and North Porter, and Mason, the report offers valuable information for improving emergency response and resource allocation.

E N D
Fire-EMS Response Time Study (In Minutes)2010 - YTD Fire EMS 5 7 21 6 9 12 9 17 22 5 13 29 6 13 22 5 13 18 S Porter N Porter Mason S Porter N Porter Mason Total RunsTotal Runs South Porter-7 South Porter- 24 North Porter- 2 North Porter- 9 Mason- 4 Mason- 22 Left bar shortest run time in minutes Center bar average run time in minutes Right bar longest run time in minutes February
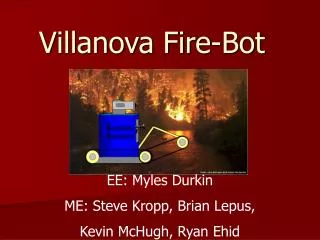
Fire-EMS Response Time Study (In Minutes)February 2010 Fire EMS 5 7 11 6 6 6 9 15 19 5 11 19 10 15 22 5 13 18 S Porter N Porter Mason S Porter N Porter Mason Total RunsTotal Runs South Porter- 3 South Porter- 11 North Porter- 1 North Porter- 6 Mason- 3 Mason- 14 Left bar shortest run time in minutes Center bar average run time in minutes Right bar longest run time in minutes
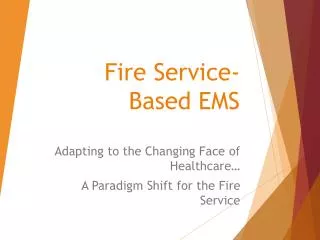
Fire-EMS Response Time Study (In Minutes)July thru December 2009 Fire EMS 1 9 17 2 9 13 1 12 20 1 10 26 2 12 28 3 10 21 S Porter N Porter Mason S Porter N Porter Mason Total RunsTotal Runs South Porter- 25 South Porter- 102 North Porter- 6 North Porter- 20 Mason- 12 Mason- 56 Left bar shortest run time in minutes Center bar average run time in minutes Right bar longest run time in minutes