
Uploaded by
lara
45 SLIDES
645 VUES
450LIKES
Data presentation Tables, graphs and maps
DESCRIPTION
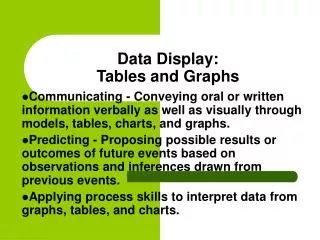
2. Outline of the session. Analogical versus digital informationTablesGraphs Maps. 3. Communicating quantitative information. Analogical communication: GraphsLess preciseMore graphicProvides overall understanding Digital communication: TablesPreciseNumericProvides detailed and exact descri
Download
1 / 45
Télécharger la présentation 
Data presentation Tables, graphs and maps
An Image/Link below is provided (as is) to download presentation
Download Policy: Content on the Website is provided to you AS IS for your information and personal use and may not be sold / licensed / shared on other websites without getting consent from its author.
Content is provided to you AS IS for your information and personal use only.
Download presentation by click this link.
While downloading, if for some reason you are not able to download a presentation, the publisher may have deleted the file from their server.
During download, if you can't get a presentation, the file might be deleted by the publisher.
E N D
Presentation Transcript


More Related