Creating Data Tables and Graphs
Creating Data Tables and Graphs. What is Data?. Data is information Examples of data include: The number of kilometers from Houston to Indianapolis The number of centimeters of rain that fall yearly in Texas The length in minutes of a Hannah Montana song. How is data used?.


Creating Data Tables and Graphs
E N D
Presentation Transcript
What is Data? • Data is information • Examples of data include: • The number of kilometers from Houston to Indianapolis • The number of centimeters of rain that fall yearly in Texas • The length in minutes of a Hannah Montana song
How is data used? • Scientists use data all the time to: • Predict the weather • Aid in the recovery of patients in hospitals • Determine the dose of a chemical or radiation that is harmful to the public
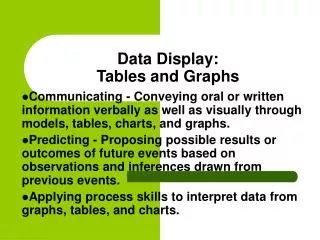
Complete Data Tables Contain: • A descriptive title • Variables describing what information has been collected • Unitstelling how those variables were measured • Datacollected in ordered pairs • All work done neatly
The Title • The title of this data table is “The Heating of Compound X.” • Without a title, it would be difficult for a person studying the table to figure out what all the numbers mean. Heating of Compound X
Variables and Units • A variable describes what information you are recording. • A unit tells how you are going to measure that variable. Heating of Compound X What is the independent variable? What is the dependent variable?
The Data • Data is organized in a data table. • The numbers in the table are organized in ordered pairs. • An ordered pair consists of an independent and dependent variable that correspond to one another. Heating of Compound X
Remember…Tiny Vicious Unicorns Drink Nectar Title Variables Units Data Neatly
What is a graph? • A graph is a picture of information in a data table. • The following data table and graph are for the Heating of Compound X. Heating of Compound X
What do the table and graph have in common? Everything! They contain the same title, variables, units, and data. Heating of Compound X
Graphs • The independent variable goes on the horizontal axis, or X-axis. • The dependent variable goes on the vertical axis, or Y-axis. Intersection for ordered pair (1, 21) 20 10 Temp. (°C) 0 0 1 2 3 4 Time (minutes)
What type of graph should I use? • One of the most challenging parts of graphing data is to decide which type of graph is appropriate for the data. • There are three main types of graphs that are often used for scientific data: pie charts, bar graphs, and line graphs.
Pie Charts • Pie charts, or circle graphs, are used to display what part of a whole each variable is. Pie charts are ideal when showing fractions or percents.
Bar Graphs • Bar graphs show how variables compare to one another. • Bar graphs look at the differences between similar things.
Line Graphs • Line graphs show how a variable changes, usually with time as the independent variable.
What type of graph should I use? Look at the following example and decide which type of graph will best fit the data. How many pets does the average family have? Answer: A Bar Graph
What type of graph should I use? Look at the following examples and decide which type of graph will best fit the data. What type of trash makes up the biggest portion of garbage? Answer: A Pie Chart
What type of graph should I use? Look at the following examples and decide which type of graph will best fit the data. How much will the temperature of a turkey change when baking for twenty minutes? Answer: A Line Graph
Game Time! • Now it’s time to collect our own data and generate a graph. • We will be measuring the number of seconds it takes to pass the beanbag ball from student to student. We will start with five students and continue adding five students until the whole class is passing the ball.
Organize the Data Football Toss
Graph the Data Time (seconds) 0 5 10 15 20 25 30 Number of Students