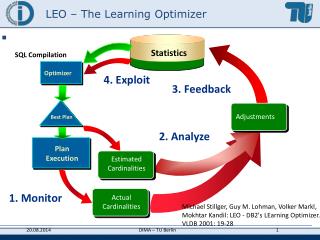
LEO – The Learning Optimizer
Statistics. Optimizer. Optimizer. Adjustments. Best Plan. Best Plan. Plan Execution. Plan Execution. Estimated Cardinalities. Actual Cardinalities. LEO – The Learning Optimizer. SQL Compilation. 4. Exploit. 3. Feedback. Adjustments. 2. Analyze. Estimated Cardinalities.

LEO – The Learning Optimizer
E N D
Presentation Transcript
Statistics Optimizer Optimizer Adjustments Best Plan Best Plan Plan Execution Plan Execution Estimated Cardinalities Actual Cardinalities LEO – The Learning Optimizer SQL Compilation 4. Exploit 3. Feedback Adjustments 2. Analyze EstimatedCardinalities 1. Monitor ActualCardinalities Michael Stillger, Guy M. Lohman, Volker Markl, Mokhtar Kandil: LEO - DB2's LEarning Optimizer. VLDB 2001: 19-28
knl Statistics Partial Results Optimizer Optimizer Best Plan With CHECK New Best Plan Best Plan Plan Execution with CHECK Progressive Optimization (POP) SQL Compilation 3 4 “MQT”with Actual Cardinality 5 2 Re-optimize If CHECK fails New Plan Execution Use feedback from cardinality errors toimprove current plan 6 1 Volker Markl, Vijayshankar Raman, David E. Simmen, Guy M. Lohman, Hamid Pirahesh: Robust Query Processing through Progressive Optimization. SIGMOD Conference 2004: 659-670
0 0 0 Mazda 323 1 0 0 0 1 0 1 1 0 1 1 1 1 0 1 0 1 1 0 0 1 red Consistent Cardinality Estimation Knowledge sY, Y T: s1 = s(Mazda) = 0.1 s2 = s(323) = 0.2 s3 = s(red) = 0.2 s1,2 =s(Mazda &323) = 0.05 s1,3 =s(Mazda& red) = 0.09 s2,3 =s(red&323) = 0.15 T = {{1}, {2}, {3}, {1,2}, {1,3}, {2,3}, } • Constraints: 0.10 = s1 = x100 + x101 + x110 + x111 0.20 = s2 = x010 + x011 + x110 + x111 0.20 = s3 = x101 + x111 + x011 + x001 0.05 = s1,2 = x110 + x111 0.09 = s1,3 = x101 + x111 0.15 = s2,3 = x011 + x111 1.00 = s = x000 + x001 + x010 + x011 + x100 + x101 + x110 + x111 Volker Markl, Nimrod Megiddo, Marcel Kutsch, Tam Minh Tran, Peter J. Haas, Utkarsh Srivastava: Consistently Estimating the Selectivity of Conjuncts of Predicates. VLDB 2005: 373-384 • Objective Function:
Correlaton Detection Through Sampling The Optimizer Ihab F. Ilyas, Volker Markl, Peter J. Haas, Paul Brown, Ashraf Aboulnaga: CORDS: Automatic Discovery of Correlations and Soft Functional Dependencies. SIGMOD Conference 2004: 647-658 CGS Profile Get Statistics RUNSTATS Recommend CGS Compute Adjustments CGS CGS DATA & CATALOG INFO Dependency Graph Estimate Cardinalities & Total Cost Sample Data Analysis Dependency Discovery Output Cheapest Plan SAMPLE
PICASSO Highly irregular plan boundaries Extremely fine-grained coverage (P68 ~ 0.02%) Increases to 80 plans with 300x300 grid ! Intricate Complex Patterns Slides: Naveen Reddy und Jayant Haritsa: “Analyzing Plan Diagrams of Database Query Optimizers”; VLDB 2005