Download
1 / 32
320 likes | 435 Vues
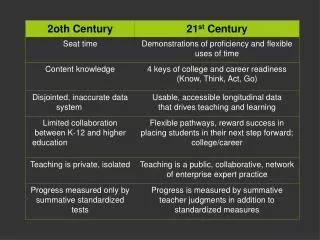
The Mekong Institute and UNESCO Regional Office in Bangkok organized a training course for trainers focused on Decentralized Education Planning in the Greater Mekong Sub-Region. Held in Khon Kaen, Thailand from February 23 to March 6, 2009, this course aimed to enhance public sector management reform in education. Participants developed skills in analyzing education indicators such as gross and net admission rates, transition rates, and enrollment statistics, addressing challenges like access, coverage, and efficiency to improve educational outcomes across the region.

E N D
Mekong Institute & UNESCO Regional Office-Bangkok Training Course on “Training of Trainers from the Greater Mekong Sub-Region on Decentralized Education Planning in the Context of Public Sector Management Reform” Education Indicators 23 February – 6 March 2009; KhonKaen, Thailand Module E3 Prepared by the Education Policy and Reform Unit UNESCO Bangkok February 2009
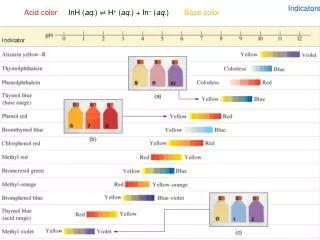
Access (1) • Gross Admission Rate # of new students enrolled in Grade 1 of Level 1 regardless of age ----------------------------------------------- population of official admission age to Level 1
Access (2) • Net Admission Rate # of new students of official admission age to Level 1 enrolled in Grade 1 in Level 1 ---------------------------------------------------------- population of official admission age to Level 1
Access (3) • Age-specific Admission Rate # of new students of age X enrolled in Grade 1 of Level 1 -------------------------------------------------population of age X NAR is a special case of AAR
Access (4) • Transition Rate # of new students enrolled in Grade 1 of Level 2 in year t ------------------------------------------------- # of students enrolled in the final grade of Level 1 in year t-1 The base is NOT the population
Coverage (1) • Gross Enrolment Rate # of students enrolled in a cycle regardless of age ------------------------------------------------- population of official age for this cycle
Coverage (2) • Net Enrolment Rate # of students of official age enrolled in a cycle ---------------------------------------------------------- population of official age for this cycle
Coverage (3) • Age-specific Enrolment Rate # of students of age X enrolled in schools regardless of cycle -------------------------------------------------population of age X
Coverage (4) • Percentage of over-aged students # of over-aged students in a cycle ------------------------------------------------- # of total students in a cycle The base is NOT the population!!
Coverage (5) • Percentage of students of non-official age # of students of non-official age in a cycle ------------------------------------------------- # of total students in a cycle Non-official age = Over-aged and under-aged
Coverage (6) • Percentage of pupils out of school (population of official age for a cycle) – (#of students of official age in a cycle) -------------------------------------------------population of official age for a cycle
Limitation • The indicators on access and coverage do not show the rate of going through the system; • Calculations requires detailed demographic data (for example, for different ages) • Certain type of data are not available regularly (example, census every ten years) • These indicators do not show the educational achievement • They may not show the real magnitude of the problem (for example, enrolment vs. enrolment rate) • International comparison needs to be made with caution taking into consideration the context.
Efficiency • “optimal relationship between input and output” • with a given output with a minimum input • with a maximum output with a given input
Efficiency in education (1) • Educational output • External efficiency • Knowledge, skills, attitudes, passing the final exam, passing the entrance exam of the next cycle, etc. • Internal efficiency • Maximum number of pupils who complete the cycle successfully within the prescribed period
Efficiency in education (2) • Educational Input (pupil-year) • Human resources - school heads, teachers, school staff, etc. • Material resources – textbooks, classroom equipment, school furniture, school building, etc.
Flow of Students Drop-out during 2006 Enrolment in Grade 1 in 2006 Repetition for Grade 1 in 2007 Promotion to Grade 2 in 2007
Promotion Rate students promoted to Grade g+1in year t+1 ------------------------------------------------------- enrolment in Grade g in year t
Repetition Rate students repeating Grade g in year t+1 ------------------------------------------------------- enrolment in Grade g in year t
Drop-out Rate students dropping out of Grade g during year t ------------------------------------------------------- enrolment in Grade g in year t
Flow rates Promotion Rate 100% Repetition Rate Drop-out Rate
Cohort • cohort – a group of persons who jointly experience a series of events over a period of time • school cohort – a group of students who enter the first grade of a given cycle in the same school year and subsequently experience promotion, repetition, drop-out, or successful completion of the final grade
Assumptions • No additional new entrants • Hypothesis of homogeneous behaviour regardless of previous behaviour • Definition of the limit of the number of repeating • Same flow rates through years
Wastage ratio actual input/output ratio ------------------------------------- ideal input/output ratio where student-years going through the system actual input/output ratio = ------------------------------------------------ successful “completers”
Survival rate total students promoted in successive years -------------------------------------------------- Initial numbers in the cohort
Average duration of study per graduate Grads_1 x Y + Grads_2 x (Y +1) + Grads_3 x (Y+2) + etc.. -------------------------------------------------------------- total graduates produced where Y = prescribed number of years to graduate
Proportion of total wastage accounted for by drop-outs DO1 x 1 + DO2 x 2 + DO3 x 3 + DO4 x 4 + DO5 x 5 + etc ----------------------------------------------------------- (total student-years) – (success grads. x ideal years to graduate)
The Concept of Quality (1) • Quality of the “inputs” • adequate human, material & curriculum resources • Quality of the “process” • internal efficiency • school functioning
The Concept of Quality (2) • Quality of the “outputs” • achievement • in knowledge, skills and values • Quality of the “outcomes” • external efficiency • impact on personal and social development
Indicators of Quality (1) • Quality of the “inputs” • % of qualified teachers • student/classroom ratio • student/textbook ratio • Quality of the “process” • repetition, drop-out, promotion rate • survival rate • % of schools with functioning PTAs • student attendance rate
Indicators of Quality (2) • Quality of the “outputs” • examination results • achievement test results • Literacy rate • Quality of the “outcomes” • % unemployed among primary, secondary, university graduates