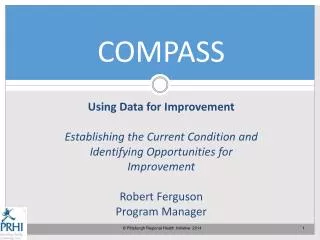
Townsville Sustainability Compass Index Workshop: Shaping a Sustainable Future
120 likes | 225 Vues
This two-day workshop involved internal and external stakeholders to assess the city's current status, develop sustainable indicators, and measure against a sustainability index. Economic, nature, society, and well-being indicators were analyzed across past, present, and future perspectives. Key indicators included economic value added, biodiversity, social cohesion, and quality of life. Despite challenges, stakeholders perceived Townsville moving in the right direction towards sustainability with room for improvement.

Townsville Sustainability Compass Index Workshop: Shaping a Sustainable Future
E N D
Presentation Transcript
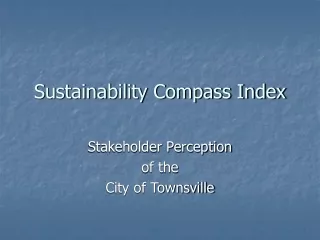
Sustainability Compass Index Stakeholder Perception of the City of Townsville
Two day workshop with internal and external stakeholders (42 persons) Considered the present status of the city based on perception and experience of stakeholders Developed sustainable indicators for the city looking at the past, present and future All indicators were indexed against sustainability 0-100 Eg. Waste Management 100 points = 100% recycling 0 points =100% to Landfill 9 indicators developed for each compass point N = Nature E = Economy S = Society W= Wellbeing Some Background
Summary of Indicators Economic Indicators Value Added Industry Knowledge Worker Intensity Self Efficiency Resource Efficiency Retain Workforce Job Creation Local Gross Product Registered Patents / Scientific Papers Percent Human Capital Utilization Nature Indicators • Number of Species - biodiversity • % cover of parkland • % of natural landscape • Clean air days • Tonnes of waste to landfill • Number of persons taking action • Water usage per capita • Marine Water Temperature • Greenhouse emissions Society Indicators • Participation in cultural and sporting events • Discretional income relative to where and how you live • Social cohesion – crime rate • Number of households adopting ESD • Educated society – tertiary degree • Number of community Volunteers • Life Expectancy • % of community in decision making processes Well-Being Indicators • Quality of Schooling and education • New local job opportunities • Personal Safety and fear of crime • Ability to deal with hot days • Quality of shopping • Employment diversity • Travel to work, shops, and amenities • Sense of community • Proximity to jobs and local services
People’s perception about the Economy of Townsville historically is poor, but……….
People see the Economy is better and future growth looks good and people are optimistic
Quality of Life dropped slightly, but people are pessimistic about the future
However, overall the City is moving in the right direction towards sustainability, but still many opportunities to be realised