Validation - Design for testability (DFT) and fault injection -
310 likes | 475 Vues
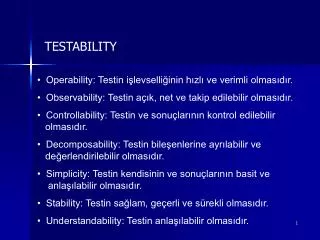
Validation - Design for testability (DFT) and fault injection -. 1. E/d. B/c. C/d. 2. 3. A/f. Testing finite state machines. Difficult to check states and transitions. For example, verifying the transition from 2 to 3 requires Getting into state 2 Application of A Check if output is f

Validation - Design for testability (DFT) and fault injection -
E N D
Presentation Transcript
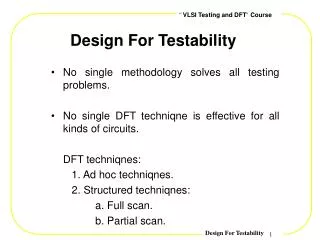
Validation- Design for testability (DFT) and fault injection -
1 E/d B/c C/d 2 3 A/f Testing finite state machines • Difficult to check states and transitions. • For example, verifying the transition from 2 to 3 requires • Getting into state 2 • Application of A • Check if output is f • Check if we have actually reached 3 • Simplified with scan design:
Scan design: usage • Verifying a transition requires • Shifting-in the „old state“ • Application of the input pattern • Checking if output is correct • Shifting-out the new state and comparing it. • Essentially reduced to testing combinatorial logic
JTAG (Boundary scan) (1) • JTAG defines a 4..5-wire serial interface toaccess complex ICs .. Any compatible IC contains shift registers &FSM to execute the JTAG functions. • TDI: test data in;stored in instruction register or in one of thedata registers.TDO: test data outTCK: clockTMS:controlsthe state of the test access port (TAP).Optional TRST* is reset signal. Source: http://www.jtag.com/brochure.php
JTAG (Boundary scan) (2) • Defines method for setting up a scan chain on a PCB Source: http://www.jtag.com/brochure.php
Limitations of a single serial scan chain • For chips with a large number of flop-flops, serial shifts can take a quite long time. • Hence, it becomes necessary to provide several scan chains. • Trying to avoid serial shifts by generating test patterns internally and by also storing the results internally. • Compaction of circuit response in a signature.Shifting the entire result out becomes obsolete, we just shift out the signature.
Response of circuit to sequence of test vectors XOR n-bit shift register Signature Signature analysis • Response of circuit to sequence of test patterns compacted in a signature. Only this signature is compared to the golden reference. • In order to exploit an n-bit signature register as good as possible, we try to use all values possible for that registers. • In practice, we use shift-registers with linear feedback: Using proper feedback bits, all values possible for the register can be generated.
0000 XOR 0001 0011 1000 0110 0111 1100 1001 1111 1011 0100 1110 0010 1101 1010 0101 Example: 4-bit signature generator 1 0 All 16 possible signatures are generated! 1 0 Source: P.K.Lala: Fault tolerant & fault testable hardware design, Prentice Hall, 1985
Aliasing for signatures Consider aliasing for some current pattern • An n-bit signature generator can generate 2n signatures. • For an m-bit input sequence, the best that we can get is to evenly map 2(m-n) patterns to the same signature. • Hence, there are 2(m-n)-1 sequences that map to the same signature as the pattern currently considered. • In total, there are 2m-1 sequences different from the current one.
Replacing serially shifted test patternby pseudo random test patterns • Shifting in test patterns can be avoided if we generate (more or less) all possible test patterns internally with a pseudo-random test pattern generator. Pseudo-random test pattern generator DUT Signature analysis register Compare with reference Effect of pseudo random numbers on coverage to be analyzed. Signature analysis register shifted-out at the end of the test.
Pseudo random test pattern generation 0000 0001 XOR 0011 Linear feedback shift register (LFSR) 1000 0110 0111 1100 1001 1111 1011 0100 1110 0010 2n-1 patterns generated! Superior to counters if not all patterns are used. 1101 1010 0101
Combining signature analysis with pseudo-random test patterns: Built-in logic block observer (BILBO) Könemann & Mucha Uses parallel inputs to compress circuit response
DUT-1 DUT-2 Bilbo-1 (generates pseudo-random test patterns) Bilbo-2 (compresses response) Typical application Compressed response shifted out of Bilbo-2 & compared to known „golden“ reference response. Roles of Bilbo-1 and 2 swapped for testing DUT-1
Fault injection • Fault simulation may be too time-consuming • If real systems are available, faults can be injected. Two types of fault injection: • local faults within the system, and • faults in the environment (behaviors which do not correspond to the specification).For example, we can check how the system behaves if it is operated outside the specified temperature or radiation ranges.
Physical fault injection • Hardware fault injection requires major effort, but generates precise information about the behavior of the real system. • 3 techniques compared in the PDCS project on the MARS hardware [Kopetz]:
MARS hardware nodes • Bus guardian protects against "babbling idiots" 2 asynchronous communication ports (RS 232) BusGuar-dian Communi-cation Unit (68070 processor) FIFO Application Unit (68070 processor) FIFO Replicated bus
Implemented error detection mechanisms • Hardware: • standard mechanism for 68070 CPU:Illegal instruction & illegal address traps; • Special mechanisms:bus guardian, FIFO overflow, power supply monitor • System software: compiler generated run-time assertions, timing checks to check WCET of RT-tasks • Application software: double execution, triple execution (two dynamic, one static in-between), end-to-end CRC
Result of comparison Fault injector Application unit error data Communic. unit error data Data generator Comparator Experimental setup • Software: typical cyclic real-time application
Results • According to experiments reported by Kopetz: • With all error-detection mechanisms enabled, no fail-silence violation was observed in any of the experiments. • End-to-end error detection mechanisms and double execution of tasks were needed for all 3 fault injection methods if a coverage of > 99% were to be achieved. • For heavy-ion radiation, triple execution was needed. • The bus guardian unit was needed in all 3 experiments if a coverage of > 99% was required.
Software fault injection • Errors are injected into the memories. • Advantages: • Predictability: it is possible to reproduce every injected fault in time and space. • Reachability: possible to reach storage locations within chips instead of just pins. • Less effort than physical fault injection: no modified hardware. Same quality of results?
Results • Software fault injection with bit-flips in the data is comparable to hardware fault injection • Application software error detection is higher for software-implemented fault injection. Most hardware-injected faults do not propagate to the application level. • If application level error detection is turned of, software fault injection generates a higher number of coverage violations than EMI or pin level injections for single task execution. • Software fault injection comparable to EMI and pin level injections. However, heavy-ion radiation is more stressful.
Example : metal migration @ Pentium 4 www.jrwhipple.com/computer_hangs.html Risk- and dependability analysis • „10-9“: For many systems, probability of a catastrophe has to be less than 10-9 per hour one case per 100,000 systems for 10,000 hours. • FIT: failure-in-time unit for failure rate (=1/MTTF1/MTBF); • 1 FIT: rate of 10-9 failures per hour • Damages are resulting from hazards. • For every damage there is a severity and a probability. • Several techniques for analyzing risks.
Actual failure rates • Example: failure rates less than 100 FIT for the first 20 years of life at 150°C @ TriQuint (GaAs) • [www.triquint.com/company/quality/faqs/faq_11.cfm] Different devices • Target: Failures rates of systems ≤ 1FIT • Reality: Failures rates of circuits ≤ 100 FIT • redundancy is required to make a system more reliable than its components
Fault tree Analysis (FTA) • FTA is a top-down method of analyzing risks.Analysis starts with possible damage, tries to come up withpossible scenarios that lead to that damage. • FTA typically uses a graphicalrepresentation of possible damages, including symbols for AND- and OR-gates. • OR-gates are used if a single event could result in a hazard. • AND-gatesare used when several events or conditions are required for that hazardto exist.
Limitations • The simple AND- and OR-gates cannot model all situations. For example,their modeling power is exceeded if shared resources of some limitedamount (like energy or storage locations) exist. • Markov models may have to be used to cover such cases.
Failure mode and effect analysis (FMEA) • FMEA starts at the componentsand tries to estimate their reliability.The first step is to create a table containingcomponents, possible faults, probability of faults and consequenceson the system behavior. • Using this information, the reliabilityof the system is computed from the reliability of its parts(correspondingto a bottom-up analysis).
Safety cases • Both approaches may be usedin “safety cases”. In such cases, an independent authority has to be convincedthat certain technical equipment is indeed safe. • One of the commonly requestedproperties of technical systems is that no single failing componentshould potentially cause a catastrophe.
Summary • Design for Test (DFT) • Scan path • Signature analysis, pseudo random patterns, BILBO • Boundary scan • Fault injection • Physical fault injection • Software fault injection • Risk- and dependability analysis • FTA • FMEA