Download

1 / 28
300 likes | 526 Vues
Individual and Market Demand Chapter 4. INDIVIDUAL DEMAND. Price Changes Using the figures developed in the previous chapter, the impact of a change in the price of food can be illustrated using indifference curves.

E N D
INDIVIDUAL DEMAND Price Changes Using the figures developed in the previous chapter, the impact of a change in the price of food can be illustrated using indifference curves. For each price change, we can determine how much of the good the individual would purchase given their budget lines and indifference curves
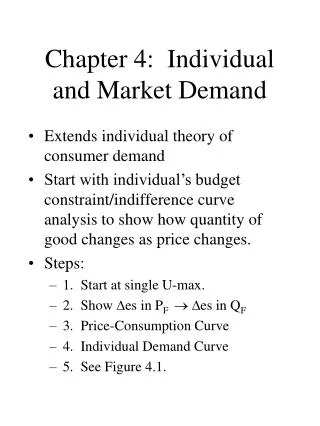
10 6 A D 5 U1 B 4 U3 U2 12 20 4 Clothing Assume: • I = $20 • PC = $2 • PF = $2, $1, $0.50 Each price leads to different amounts of food purchased Food (units per month)
Effect of a Price Change ●price-consumption curve: Curve tracing the utility-maximizing combinations of two goods as the price of one changes. individual demand curve: Curve relating the quantity of a good that a single consumer will buy to its price.
Effect of a Price Change • By changing prices and showing what the consumer will purchase, we can create a demand schedule and demand curve for the individual • From the previous example:
Price of Food E $2.00 Demand Curve G $1.00 $.50 H Food (units per month) 4 12 20 Effect of a Price Change Individual Demand relates the quantity of a good that a consumer will buy to the price of that good.
Demand Curves – Important Properties • The level of utility that can be attained changes as we move along the curve. • At every point on the demand curve, the consumer is maximizing utility by satisfying the condition that the MRS of food for clothing equals the ratio of the prices of food and clothing
Price of Food E $2.00 G $1.00 $.50 H Food (units per month) 4 12 20 Demand Curve Effect of a Price Change When the price falls: Pf/Pc & MRS also fall • E: Pf/Pc = 2/2 = 1 = MRS • G: Pf/Pc = 1/2 = .5 = MRS • H:Pf/Pc = .5/2 = .25 = MRS
7 D U3 5 U2 B 3 U1 A 4 10 16 Effects of Income Changes Clothing (units per month) Assume: Pf = $1, Pc = $2 I = $10, $20, $30 An increase in income, with the prices fixed, causes consumers to alter their choice of market basket. Food (units per month)
Income Changes • When the income-consumption curve has a positive slope: • The quantity demanded increases with income. • The income elasticity of demand is positive. • The good is a normal good. • When the income-consumption curve has a negative slope: • The quantity demanded decreases with income. • The income elasticity of demand is negative. • The good is an inferior good
Engel Curves • Engel curves relate the quantity of good consumed to income. • If the good is a normal good, the Engel curve is upward sloping. • If the good is an inferior good, the Engel curve is downward sloping.
Income ($ per month) 30 20 10 Food (units per month) 4 8 12 16 Engel Curves Engel curves slope upward for normal goods.
Substitutes & Complements • Two goods are substitutes if an increase in the price of one leads to an increase in the quantity demanded of the other. Ex: movie tickets and video rentals • Two goods are complements if an increase in the price of one good leads to a decrease in the quantity demanded of the other. Ex: gasoline and motor oil • Two goods are independent if a change in the price of one good has no effect on the quantity demanded of the other Ex: chicken and airplane tickets
Substitutes & Complements • A change in the price of a good has two effects: • Substitution Effect • Income Effect
Income and Substitution Effects • Substitution Effect • Relative price of a good changes when price changes • Consumers will tend to buy more of the good that has become relatively cheaper, and less of the good that is relatively more expensive. • Income Effect • Consumers experience an increase in real purchasing power when the price of one good falls.
Substitution Effect • The substitution effect is the change in an item’s consumption associated with a change in the price of the item, with the level of utility held constant. • When the price of an item declines, the substitution effect always leads to an increase in the quantity demanded of the good. • Income Effect • The income effect is the change in an item’s consumption brought about by the increase in purchasing power, with the price of the item held constant. • When a person’s income increases, the quantity demanded for the product may increase or decrease. • Even with inferior goods, the income effect is rarely large enough to outweigh the substitution effect.
When the price of food falls, consumption increases by F1F2 as the consumer moves from A to B. R The substitution effect,F1E, (from point A to D), changes the relative prices but keeps real income (satisfaction) constant. C1 A The income effect, EF2, ( from D to B) keeps relative prices constant but increases purchasing power. D B C2 U2 Substitution Effect U1 F1 E S F2 T Total Effect Income Effect Income and SubstitutionEffects: Normal Good Clothing (units per month) Food (units per month)
Since food is an inferior good, the income effect is negative. However, the substitution effect is larger than the income effect. B U2 Total Effect Income Effect Income and SubstitutionEffects: Inferior Good Clothing (units per month) R Substitution Effect U1 Food (units per month) F1 E S F2
Market Demand • Price Elasticity of Demand • Measures the percentage change in the quantity demanded resulting from a percent change in price.
Market Demand Inelastic Demand Ep is less than 1 in absolute value Quantity demanded is relative unresponsive to a change in price %Q < %P Total expenditure (P*Q) increases when price increases
Market Demand Elastic Demand Ep is greater than than 1 in absolute value Quantity demanded is relative responsive to a change in price %Q > %P Total expenditure (P*Q) decreases when price increases
Price Elasticity of Demand • Isoelastic Demand • When price elasticity of demand is constant along the entire demand curve • Demand curve is bowed inward (not linear)
Example Domestic demand for wheat is given by the equation QDD = 1430 – 55P where QDD is the number of bushels (in millions) demanded domestically, and P is the price in dollars per bushel. Export demand is given by QDE = 1470 − 70P where QDE is the number of bushels (in millions) demanded from abroad. To obtain the world demand for wheat, we set the left side of each demand equation equal to the quantity of wheat. We then add the right side of the equations, obtaining QDD + QDE = (1430 − 55P) + (1470 − 70P) = 2900 − 125P
Consumer Surplus • Consumers buy goods because it makes them better off • Consumer Surplus measures how much better off they are • The difference between the maximum amount a consumer is willing to pay for a good and the amount actually paid. • Can calculate consumer surplus from the demand curve
Market Price Demand Curve Actual Expenditure Consumer Surplus Consumer Surplus for the Market Demand 20 Price ($ per ticket) 19 CS = ½ ($20 - $14)*(1600) = $19,500 18 17 16 15 14 0 1 2 3 4 5 6 Rock Concert Tickets
Empirical Estimation of Demand • Estimating Elasticities • For the demand equation: Q = a - bP • Elasticity: Assuming: Price & income elasticity are constant • The isoelastic demand = The slope, -b = price elasticity of demand Constant, c = income elasticity of demand
Using the Raspberry data: Price elasticity = -0.24 (Inelastic) Income elasticity = 1.46 • Substitutes: b2 is positive • Complements: b2 is negative
Price elasticity = -2.0 Income elasticity = 0.62 Cross elasticity = 0.14