Download
1 / 13
130 likes | 308 Vues
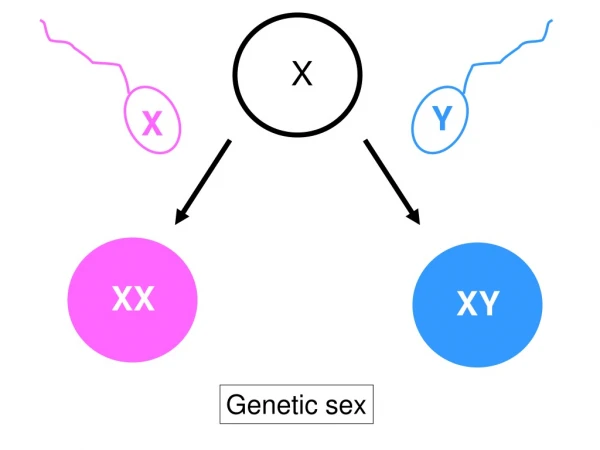
Genetic and physical maps around the sex-determining M -locus of the dioecious plant asparagus. Telgmann-Rauber et al. 2007. Background. The M -locus controls sexual dimorphism MM = supermale Mm = male mm = female In breeding male genotypes are desired Higher yield Longevity

E N D
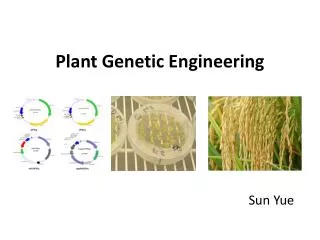
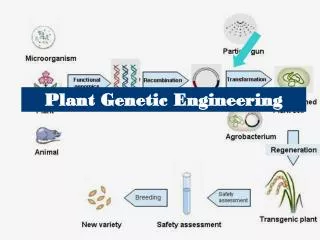
Genetic and physical maps around the sex-determining M-locus of the dioecious plant asparagus Telgmann-Rauber et al. 2007
Background • The M-locus controls sexual dimorphism • MM = supermale • Mm = male • mm = female • In breeding male genotypes are desired • Higher yield • Longevity • Markers at this locus would be useful to differentiate MM and Mm genotypes
Author’s goals • Clone the region determining sex in asparagus from its position in the genome • Develop markers in this region to use in asparagus breeding programs
Previous work • The M-locus was fine-mapped to the sex chromosome L5 (Reamon-Büttner et al. 1998) • 15 markers were used to construct a high density map around the M-locus (Jamsari et al. 2004)
Materials and Methods • Bulked Segregant Analysis was used to develop new AFLPs • BSA uses two bulked pools of segregants differing for 1 trait, where the pools differ is likely to be the region controlling the trait • 809 F3 individuals were used for mapping • F3 individuals were created by selfing 3 andromonoecious plants in the F2 generation • 1-2% plants are andromonoecious • New markers were mapped using JoinMap
Materials and Methods • Used a BAC library with 86,784 clones (5.5X coverage) • BACs were screened with 5 AFLP primer combinations • Positive clones were then aligned into contigs using FPC software • 4 BACS were partially sequenced to identify consensus sequences • Sequences were then blasted to identify putative ORFs • Also ran FISH for physical mapping
Results • Found 12 novel AFLPs cosegregating with the M-locus • 11 BACs identified using 5 AFLP combos • 39 BACs identified by chromosome walking • Aligned BACS still miss the M-locus
Figure 1 - Genetic and Physical Map Markers BACs
Figure 2 - sequencing results 53% of hits had homology to transposons/retrotransposons
FISH results Probes based off BACs were found to hybridize to centromeric and pericentromeric regions
Conclusions • Created a detailed map with 26 markers spanning 8.01cM around the M-locus • Could not close the gap around the M-locus • Marker density not high enough • M-locus not evenly represented in BACs
Conclusions • Recombination frequency is reduced in the M-locus region • Gene density in this region is low • The sex locus is enriched for repetitive sequences • The locus is likely to be near a cetromeric or pericentromeric region
Future direction • Create more markers • Use a different BAC library • Expression profiling using subtractive hybridization/microarray technologies