Download
1 / 19
190 likes | 330 Vues
Evaluation of CMAQ Performance During the Rocky Mountain Atmospheric Nitrogen and Sulfur (RoMANS) Study. U. Shankar 1 , B. Henderson 2 , S. Arunachalam 1 , Z. Adelman 1 , N. Davis 1 , L. Ran 1 , E. Adams 1 , M. Barna 3 , and M. Rodriguez 3 8th Annual CMAS Conference

E N D
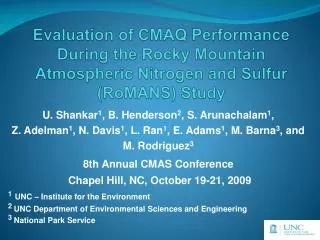
Evaluation of CMAQ Performance During the Rocky Mountain Atmospheric Nitrogen and Sulfur (RoMANS) Study U. Shankar1, B. Henderson2, S. Arunachalam1, Z. Adelman1, N. Davis1, L. Ran1, E. Adams1, M. Barna3, and M. Rodriguez3 8th Annual CMAS Conference Chapel Hill, NC, October 19-21, 2009 1UNC – Institute for the Environment 2 UNC Department of Environmental Sciences and Engineering 3 National Park Service
Outline RoMANS Field Campaign Overview Context for Modeling Study Model Setup Current Results Conclusions Next Steps
RoMANS Field Campaign Goal: To reduce deleterious effects on sensitive ecosystems due to atmospheric sulfur and nitrogen compounds Current estimate of inorganic N wet dep + dry dep of HNO3, NO3 and NH4 ≈ 4 kg/ha/yr 20-fold increase since Western pre-industrial values Objectives Identify S/N mix, ambient and deposited, on both sides of Continental Divide Identify important sources and transport pathways within and outside Colorado responsible for the S/N in Rocky Mountain National Park Identify relative contributions of different source types within Colorado to S/N species observed
RoMANS Field Campaign Observation period was aimed at capturing the seasonality in meteorology, and understanding S/N source contributions and chemistry Spring 2006: March 25 – April 30 (season for upslope, synoptic storms) Summer 2006: July 6 – August 12 (convective precip) Measurements at high temporal frequency to resolve changes in pollutant transport patterns and identify source types
RoMANS Measurements- Chemistry Measured daily at 8 sites in spring, 6 sites in summer, and sub-hourly at core site, collocated w/ IMPROVE monitor; PM size measured at core site
RoMANS Measurements – Meteorology and Visibility Measured winds, precip, temperature, RH and light scattering
Context for Modeling Study NH4 Mean Fractional Error NH4 Mean Fractional Bias • Initial modeling of RoMANS by NPS using CAMx found severe underprediction of (gas and particulate) ammonia • Suspected emissions, dry dep of NH3 • Under a NASA ROSES UNC needed a demo application of the pyPA tool soon that it would port to VIEWS (End users: WRAP, NPS, …) • Opportunity for a diagnostic evaluation of CMAQ against RoMANS and an inter-model comparison
CMAQSimulation Setup • Nested runs at 36- , 12- and 4-km • 19 vertical levels • CMAQ v4.7: CB05 w/ aero5 and Cl • BCs from GEOS-Chem for ConUS domain • Soil NH3 correction to 2002 RPO EI Initial focus of analyses is high wet dep event during strong upslope flow April 23-25 ’06
Conclusions • Preliminary results indicate that CMAQ is underbiased w.r.t. observations in both oxidized and reduced PM nitrate constituents and comparable to that in CAMx • The % mean bias is somewhat lower for ammonium than for nitrate • The agreement is better in the daily data (secondary and satellite sites) than in the sub-hourly (core site)
Next Steps • Compare NH3 and HNO3 concentrations and deposition amounts against observed concentrations, depositions and met data • Compare against satellite data of NO2, AOD • Run pyPA • Compare with CAMx pyPA results to identify the processes contributing to the biases in each model
Acknowledgements • NASA Grant # NNX08AL28G


![Euro ( €) versus the U. S. $ [Interbank Rate – 1/1/99 to 2/1/13]](https://cdn3.slideserve.com/5629681/euro-versus-the-u-s-interbank-rate-1-1-99-to-2-1-13-dt.jpg)