Mapping Race and Poverty Changes in the US: A Comparative Analysis from 2000 to 2010
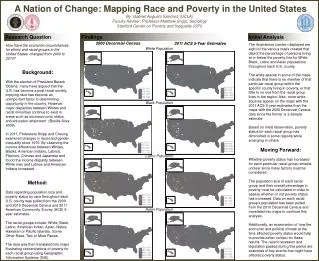
Analyzing the illustrations displaying maps depicting poverty percentages for White, Black, Latino, and Asian populations across U.S. counties. The study examines changes in poverty rates for different racial groups and explores how economic and political factors may have influenced these trends. Research explores disparities between racial groups and the impact of the recent recession on poverty status. The study aims to provide insights into racial and economic circumstances in the United States over the specified period.

Mapping Race and Poverty Changes in the US: A Comparative Analysis from 2000 to 2010
E N D
Presentation Transcript
Analysis • The illustrations (center) displayed are eight of the various maps created that depict the percentage of persons living at or below the poverty line for White, Black, Latino and Asian populations throughout each U.S. county. • The white spaces in some of the maps indicate that there is no member of that particular racial group within the specific county living in poverty, or that little to no one from the racial group lives in the region. Also, more white squares appear on the maps with the 2011 ACS 5-year estimates than the maps with the 2000 Decennial Census data since the former is a sample estimate. • Based on initial observation, poverty status for each racial group has diminished in some regions while emerging in others. • Moving Forward: • Whether poverty status has increased for each particular racial group remains unclear since many factors must be considered. • The population size of each racial group and their overall percentage in poverty must be calculated in order to assess whether or not poverty status has increased. Data on each racial group’s population has been pulled from the 2010 Decennial Census and translated into maps to continue this analysis. • Additionally, an examination of how the economic and political climate at the time affected poverty status would help to provide better context for these results. The recent recession and legislation passed during this period are examples of key events that might have affected poverty status. • Research Question: • How have the economic circumstances for ethnic and racial groups in the United States. changed from 2000 to 2010? • Background: • With the election of President Barack Obama, many have argued that the U.S. has become a post-racial society, implying race has become an unimportant factor in determining opportunity in the country. However, major disparities between Whites and racial minorities continue to exist in areas such as socioeconomic status and education attainment (Bonilla-Silva 2008). • In 2011, Professors Snipp and Cheung examined changes in racial and gender inequality since 1970. By observing the income differences between Whites, Blacks, American Indians, Latinos, Filipinos, Chinese and Japanese and found the income disparity between White men and Latinos and American Indians increased. • Method: • Data regarding population size and poverty status by race throughout each U.S. county was pulled from the 2000 and 2010 Decennial Census and 2011 American Community Survey (ACS) 5-year estimates. • The racial groups include: White, Black, Latino, American Indian, Asian, Native Hawaiian or Pacific Islander, Some Other Race, Two or More Races. • The data was then translated into maps illustrating concentrations of poverty for each racial group using Geographic Information Systems (GIS). Research Question Findings Initial Analysis 2000 Decennial Census 2011 ACS 5-Year Estimates White Population A Nation of Change: Mapping Race and Poverty in the United StatesBy: Gabriel Augusto Sanchez (UCLA)Faculty Adviser: Professor Matthew Snipp, SociologyStanford Center on Poverty and Inequality (CPI) Black Population Latino Population Asian Population