Nanomechanics: Atomistic Modeling
560 likes | 793 Vues
Nanomechanics: Atomistic Modeling. Introduction Energy Kinetics Kinematics Damage Mechanics. Mark F. Horstemeyer, PhD CAVS Chair Professor in Computational Solid Mechanics Mechanical Engineering Mississippi State University mfhorst@me.msstate.edu. Outline.

Nanomechanics: Atomistic Modeling
E N D
Presentation Transcript
Nanomechanics: Atomistic Modeling • Introduction • Energy • Kinetics • Kinematics • Damage Mechanics Mark F. Horstemeyer, PhD CAVS Chair Professor in Computational Solid Mechanics Mechanical Engineering Mississippi State University mfhorst@me.msstate.edu Outline
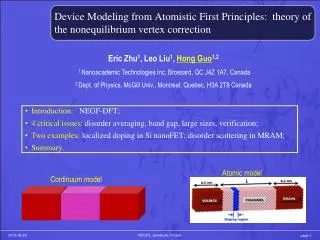
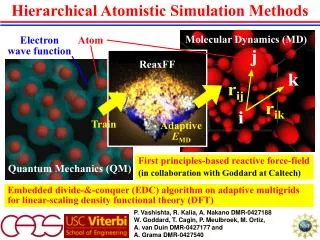
METHODS USED DEPEND ON THEENTITY BEING MODELED MethodEntityExamples first principles electron density functional theory (DFT) quantum chemistry (QC) semi-empirical atom embedded atom method (EAM) modified EAM (MEAM) N-body, glue empiricalatom, grain, Lennard-Jones (LJ), Potts dislocationdislocation dynamics (DD) phenomenacontinuum Ficks Law field elasticity/plasticity
Total energy E • Fi : embedding energy of atom i • i : electronic density of atom i • r ij : separation distance between atom i and j • ij : pair potential of atom i and j Energy: Embedded Atom Method (EAM) • Molecular Dynamics (f=ma, finite temperatures) • Molecular Statics (rate independent, absolute zero) • Monte Carlo Simulations (quasi-static, finite temperatures)
Determination of Atomic Stress Tensor (Daw and Baskes, 1984, Phys. Rev) Embedded Atom Method (EAM) and Modified Embedded Atom Method (MEAM) potentials Local force determined from energy Dipole Force Tensor (virial stress) is determined from local forces Note: the difference between EAM and MEAM is an added degree of angular rotations that affect the electron density cloud . For EAM, this quantity is simply a scalar, but for MEAM it includes three terms that are physically motivated:
EAM Represents the properties of Nickel extremely well • Calc. Expt. • Lattice Constant (Å) 3.52 3.52 • Cohesive Energy (eV) 4.45 4.45 • Vacancy Formation Energy (eV) 1.59 1.6 • Elastic Constants (GPa) • C11 246.4 246.5 • C12 147.3 147.3 • C44 124.8 124.7 • Surface Energy (mJ/m2) 2060 2380 • Stacking Fault Energy (mJ/m2) 85 125
CURRENTLY DEVELOPED MEAM FUNCTIONS COVER MOST OF THE PERIODIC TABLE H He Be Li B C N O Al Si Mg Na P S K Ca Sc Cr Ga Ge Ti V Mn Fe Co Ni As Cu Zn Ag Ru Rh Pd Sr Y Zr Nb Mo Cd In Sn Sb La Hf Ta W Re Ir Pt Au Hg Pb Bi Ba Tl Pr Nd Gd Tb Dy Ho Er Pu Th U BCC FCC Impurities DIA CUB HCP
Kinetics: Historical Background Atomistic Stress Clausius, Maxwell Viral Theorem, 1870 Maxwell Tensor form of Virial, 1874 Rayleigh, 1905 Irving-Kirkwood, 1949 Generalized Continuum Theories Cosserat 1909 Truesdell, Toupin, Mindlin, Eringen, Green-Naghdi 1960s
GEOMETRY FOR ATOMISTIC CALCULATIONS periodic in z y x z • atoms follow Newton’s second law • temperature maintained at 300K atoms moved at constant velocity periodic, free surface, or GB in x fixed atoms
Deyield Deyield 107 atoms (a) (b) Shear stress-strain curve of material blocks at an applied strain rate of 2.4e8/sec with (a) ten thousand atoms and (b) ten million atoms showing microyield 1 at the proportional limit, microyield 2 at 0.2% offset strain, and macroyield.
5 4 3 2 1 0 0 0.05 0.1 0.15 0.2 0.25 0.3 EVOLUTION OF DISLOCATION SUBSTRUCTURE shear stress (GPa) Strain rate 108/sec T = 300K shear strain
14 14 12 12 10 10 8 8 shear stress (GPa) 2.4e8/sec 6 6 1.53e10/sec 4 4 2.4e8/sec 6.58e9/sec 1.53e10/sec 2 2 5.26e10/sec 0 0 0 0.05 0.1 0.15 0.2 0.25 0 0.05 0.1 0.15 0.2 shear strain shear strain LARGER SAMPLES HAVE CONSIDERABLY LESS STRUCTURE IN THE STRESS/STRAIN CURVES shear stress (GPa) 106 atoms 0.16 mm x 0.08 mm 107 atoms 0.5 mm x 0.25 mm
5 12 4 single slip 10 double slip quadruple slip octal slip 3 8 pseudopolycrystal 6 2 4 1 2 0 0 0 0.1 0.2 0.3 0.4 0.5 0.6 0 0.1 0.2 0.3 0.4 0.5 0.6 Schmid type plasticity observed at nanoscaleHorstemeyer, M.F. Baskes, M.I., Hughes, D.A., and Godfrey, A. "Orientation Effects on the Stress State of Molecular Dynamics Large Deformation Simulations," Int. J. Plasticity, Vol. 18, pp. 203-209, 2002. resolved shear stress (GPa) shear stress (GPa) shear strain shear strain Strain rate 1010/sec T = 300K
Yield Stress Depends on Specimen Size Because of Dislocation Nucleation Dominance Horstemeyer, M.F., Plimpton, S.J., and Baskes, M.I."Size Scale and Strain Rate Effects on Yield and Plasticity of Metals," Acta Mater., Vol. 49, pp. 4363-4374, 2001. Strain rate 2.4 x 10⁸/sec T= 300K
T A SIMPLE MODEL TO EXPLAIN STRAIN RATE DEPENDENCE Dislocation is nucleated at a distance x0 from the free surface at a critical stress s* T Dislocation accelerates according to classical law Effective stress depends on image stress, Peierls barrier, and orientation At nucleation there is no net stress on the dislocation Yield is defined when r b x = 0.2%
Experimental data examining yield stress versus applied strain rate from Follansbee (1988) and Edington (1969) for copper.
1332 atoms 2e4 atoms 1e5 atoms 106 atoms 107 atoms 108 atoms (1.6 microns) exp (Maloy et al. 1995) 0.15 Experiment 0.1 yield stress/elastic modulus 0.05 0 5 7 9 11 0.001 0.1 10 1000 10 10 10 10 strain rate (1/sec) PREDICTED STRAIN RATE DEPENDENCE OF YIELD STRENGTH IS CONSISTENT WITH EXPERIMENTS Calculations
g h i c f b e a d Strain Rate and Size Scale Effects
Volume averaged stress is a function of volume per surface area 1 0.1 yield stress/elastic modulus 0.01 0.001 0.0001 10-5 size (m) 10-6 10-10 10-8 10-6 0.0001 0.01 1 Horstemeyer, M.F. and Baskes, M.I., “Atomistic Finite Deformation Simulations: A Discussion on Length Scale Effects in Relation to Mechanical Stresses,” J. Eng.Matls. Techn. Trans. ASME, Vol. 121, pp. 114-119, 1998. interfacial force microscopy experiments • Conventional theory predicts that yield stress is independent of sample size • Because of their small size, properties of materials to be used in nano-devices are predicted to be vastly different than the properties of materials used in conventional devices EAM calculations indentation and torsion experiments large scale experiments Horstemeyer, M.F., Plimpton, S.J., and Baskes, M.I."Size Scale and Strain Rate Effects on Yield and Plasticity of Metals," Acta Mater., Vol. 49, pp. 4363-4374, 2001.
Size Scale is related to Dislocation Nucleation (volume per surface area) and strain gradients normalized resolved yield stress not converged rst strain rate • EAM Ni • Expt. various fcc metals • Free surface BC • T = 300 K Gerberich, W.W., Tymak, N.I., Grunlan, J.C., Horstemeyer, M.F., and Baskes, M.I., “Interpretations of Indentation Size Effects,” J. Applied Mechanics, Vol. 69, No. 4, pp. 443-452, 2002
Schematic showing the stress-strain responses at four different size scales. length scale 1: nanoscale stress length scale 2: submicron scale length scale 3: microscale length scale 4: macroscale strain
Determination of Stress Edge dislocation Dislocations are fundamental defects related to plasticity and damage
Comparison of stress asymmetry in a simple shear simulation at 300K with one dislocation sig21 distance for 12 stress component distance for 21 stress component sig12 Distance range is 4-48 Angstroms from center of dislocation
Comparison of stress asymmetry in a simple shear simulation at 300K with four dislocations sig21 distance for 12 stress component distance for 21 stress component Distance range is 12-44 Angstroms from center of three dislocations sig12
Comparison of stress asymmetry in a simple shear simulation at 10K with one dislocation sig21 distance for 12 stress component distance for 21 stress component sig12 Distance range is 4-48 Angstroms from center of dislocation
Comparison of stress asymmetry in a simple shear simulation at 10K with four dislocations sig21 distance for 12 stress component distance for 21 stress component Distance range is 12-44 Angstroms from center of three dislocations sig12
Comparison of stress asymmetry in a pure shear simulation at 10K with four dislocations distance for 12 stress component distance for 21 stress component -sig12 Distance range is 12-44 Angstroms from center of three dislocations -sig21
Comparison of stress asymmetry in a pure shear simulation at 10K with one dislocation distance for 12 stress component distance for 21 stress component -sig12 Distance range is 12-44 Angstroms from center of three dislocations -sig21
Local Continuum Theory Equations Local Continuum Equations Where constants A, B incorporate elastic constants and boundary conditions
Nonlocal Continuum Theory Equations Nonlocal Continuum, Eringen 1977 where, a: internal characteristic length k: constant b: relative radial displacement
EVOLUTION OF MICROSTRUCTURE SHOWSTWIN FORMATION 4.3% 5% 2.3% 4.8% tension compression slice through sample
140Å 70Å 35Å 35Å [1 0 0] [0 1 1] [0 1 1] [0 1 1] [0 1 1] [1 0 0] [1 0 0] [1 0 0] [0 1 1] [1 0 0] [2 10 10] [10 1 1] 35Å Simulation Setup Single crystal 5800 atoms Low angle grain boundary 5860 atoms High angle grain boundary 5840 atoms
Fixed Prescribed velocity V=0.035 Å/ps Fixed ends Forward loading 300 K Periodic Periodic Fixed Fixed Flexible Prescribed velocity V=0.035 Å/ps Flexible ends Forward loading 300 K Periodic Periodic Fixed Fixed Boundary Conditions
Bauschinger Stress Parameter / Bauschinger Effect Parameter • f: stress in the forward load path at reverse point • r: yield stress in the reverse load path • y: initial yield stress in the forward load path • Bauschinger effects indicated by BSP and BEP • The larger the BSP and BEP are, the stronger the Bauschinger effect Bauschinger Effect Analysis
Bauschinger Effect Results • BSP and BEP for fixed ends, reverse load at 9% strain • BSP and BEP for flexible ends, reverse load at 8% strain
Bauschinger Effects Summary • Less constrained materials exhibit reduced yield stresses compared to highly constrained materials • Single crystal material has the smallest Bauschinger effects while high angle GB material has the strongest for both fixed-end and flexible-end BC’s • Dislocation nucleation occurs earlier in low angle GB than single crystal and high angle GB cases for both BC’s
Kinematics/Strain • No size scale effects observed • Macroscale torsion experiments, crystal plasticity, and atomistics show the same plastic spin independent of size scale • Macroscale internal state variable theory, crystal plasticity, and atomistics show same strain contours independent of size scale • High rate plastic collapse of same geometry in macroscale experiments show identical result at atomistic results
Crystal plasticity/finite element simulation of torsion single crystal Cu max CCW rotation Plastic Spin max CW rotation peaks oscillation troughs Displ.
peaks troughs Plastic Spin is same throughout length scales wave amplitude ratio=A/L A L
STRAIN CONTOURS AT 30% STRAIN - 8x1 Aspect Ratio ISV atomistics crystal plasticity orientation angle - crystal plasticity
Average yield stress for a block of material of varying aspect ratios computed with different modeling methods: a) constant y, varying x; b) constant x, varying y. (a) (b)
13 Å 60 Å y x z 30 Å EAM Model, Single-crystal Copper (1 3 4), Periodic in z (4 unit cells) constant velocity and strain rate of 109 s-1
Crack initiation point 40ms FEA Experimental 112.2 ps Copper (1 3 4)Partial Collapse
EAM anisotropic inelastic behavior flow localization point 219.8 ps experimental FEA 8.328ms (removed at 5.5ms) Copper (1 3 4)Fully Collapse