Download
1 / 26
270 likes | 562 Vues
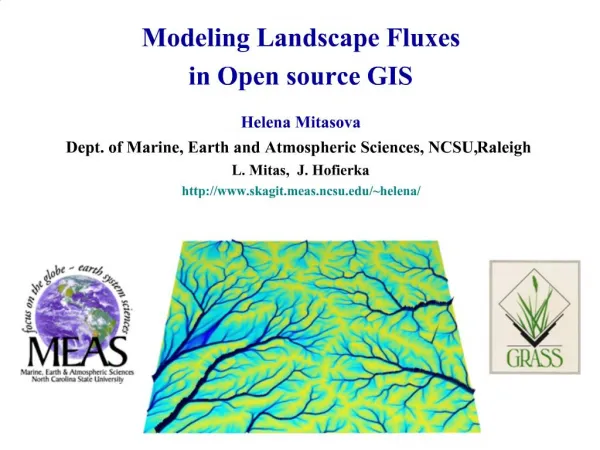
Modeling in GIS RESM 440 Lecture 16. Overview. Topic: Modeling in GIS Extra readings: Goodchild (GIS and Modeling Overview ) Bolstad (Chapters 12 and 13). Modeling in GIS. What is modeling? Attempting to simulate real-world processes in GIS

E N D
Overview • Topic: • Modeling in GIS • Extra readings: • Goodchild(GIS and Modeling Overview) • Bolstad(Chapters 12 and 13)
Modeling in GIS • What is modeling? Attempting to simulate real-world processes in GIS • Static model: One point in time • Dynamic model: Several points in time • Spatial model: shows variation in phenomenon over earth’s surface
Purposes of models • Static models • Estimation • Prediction • Assessment of current conditions • Analysis of sensitivity, vulnerability, or suitability • Indicator variables • Dynamic models • View change over time • Perform “what if” scenarios
Aspects of models • Spatial resolution: level of spatial detail • Temporal resolution: Length of time step in model • Both need to be appropriate for the analysis question and study area • Uncertainty: Models are never perfect representations of the real world
How modeling benefits from GIS • Old models: • Analog: Overlay transparencies, tracing paper, markers • GIS models: • Represent spatial variation well • Tools for pre-processing, setting up data layers in GIS • Tools for post-processing display, query of results in GIS • Automated modeling (iterations), interface to other modeling software The OLD way
Developing models • Flowcharts • Helps conceptualize your model • Graphical representation of model with standard symbols • Shows input data layers, geoprocessing steps, decisions, results • Model Builder • In ArcGIS • Helps assemble multi-step processes
Assessing models: Are the results valid? • How do you decide if a model “works”? • Sensitivity analysis: parameters, inputs are varied to see their impact on the results • Verification: compare results to known observations • Assess error and uncertainty: confidence limits
Modeling examples • Static models - examples • Methods for spatial estimation • RUSLE: Soil erosion model • Wildlife habitat modeling • Suitability modeling • Dynamic models - examples • Weather/climate • Land use modeling • Urban growth/buildout models • LANDIS forest structure model • Virtual reality models: 3D analysis in GIS (coming up)
Spatial estimation methods • GIS can be used to estimate values for unsampled locations (Bolstad, Ch 12) • Why make estimates? • Impractical or impossible to visit or sample all possible locations • Cost, logistics, accessibility, fixing outlier points • Spatial interpolation: Predicting values at unsampled locations based on values at known locations
Applications of spatial interpolation • Rainfall, snowfall, temperature, other climate variables • Pollution concentrations • Elevation, depth • Population Lake Erie Depth (ft)
Use of GIS in spatial estimation • Interpolation methods in GIS software: See Bolstad, Chapter 12 for more details
Use of GIS in estimation • Other functions of GIS: • Set up sampling schemes • Generate random sample points • Select random subset of your data • Generate systematic sample points • Statistical analyses • Extract values at points • Geostatistical Analyst extension Examples from Hawth’s Tools extension www.SpatialEcology.com
Example GIS model: RUSLE • RUSLE = Revised Universal Soil Loss Equation • A = R * K * L * S * C * P
Example: Fire danger model (USFS) • Fire danger rating updated daily by USFS • Current weather • Recent weather • Fuel type • Live/dead fuel moisture Source: USDA Forest Service Wildland Fire Assessment System http://www.wfas.us/ (Map for 3/4/14)
Example: Wildlife distribution model • Wildlife modeling: • Predict occurrence (presence/absence) • Predict abundance • Kentucky Warbler model • Key landscape variables: • Proportion of forested land cover • Brown-headed cowbird abundance • Mean wetness Source: USGS Upper Midwest Science Center – Dr. Wayne Thogmartin http://www.umesc.usgs.gov/terrestrial/migratory_birds/bird_conservation/bcr28_kentucky_warbler.html
Suitability modeling • Spatial decision support: Using GIS based models to aid in decision making • Suitability modeling: integration of multiple criteria and criteria weights to find best solution(s) to a spatial ranking question • Used to identify / rank locations for many purposes • Used by: • Land managers (USFS, BLM, NPS, states, counties) • Municipalities and local governments (cities, towns etc.) • Many others
Example: Suitability modeling • Modeling susceptibility to introduction of forest pests (i.e. suitability for pests!) • Example: • Emerald Ash Borer • Insect pest species, targets ash trees, present across Midwest (and in WV as well) • How it works: • Map individual risk factors • Combine risk factors together into overall suitability map, using different weights for different factors • Helps identify areas with high risk • Identify areas for future monitoring or prevention efforts
Seasonal Home Density Example: Emerald Ash Border (EAB) • EAB introduction risk mapping (MN example) Risk factors: • Sawmills • Campgrounds • Seasonal homes • Tree nurseries • Urban areas • Firewood dealers • Don’t move firewood! Sawmills by risk value Campgrounds by risk value Source: Minnesota Department of Agriculture http://www.mda.state.mn.us/invasives/eab
Example: Emerald Ash Borer (EAB) • Results: • Simple model: all equal • Complex model: Use weighting scenarios
Dynamic models • Modeling growth or change over time • Examples: • Weather/climate models • Land use simulation • Urban growth • Forest disturbance
Example: Weather/climate • Climate/weather are functions of global processes • Seasonal variations in surface temperature Source: Department of Geography, University of Oregon (climate animations) http://geography.uoregon.edu/envchange/clim_animations/
Example: Weather/climate • Climate/weather are functions of global processes • Seasonal variations in runoff/water surplus
Example: Land use change simulations • Land use changes for the past 300 years (1700-1990) • Based on historical records, census, satellite data Source: Historic Land Use Estimations, Center for Sustainability and the Global Environment (U Wisconsin) http://www.ncdc.noaa.gov/paleo/ctl/landuse.html
Example: Urban growth models • Urban growth and sprawl can be modeled over time using GIS: • Chesapeake Bay Foundation: SLEUTH model of urban growth, Washington DC area under different scenarios • 80% increase in urban land by 2030 (no changes) • 30% increase with moderate controls • Model accounts for: • Dispersion (random growth) • Centers of growth • Growth at edges • Effect of roads • Topography/slope limitations 2000 2030 Web Link: http://www.savethebay.org/land/landuse/maps/future_growth.html
Review • Modeling • Static models • Dynamic models (change over time) • Advantages of modeling in GIS • Coming up in lecture after break: • Final exam review • 3D or virtual modeling • New frontiers in GIS