Scientific Poster:
Scientific Poster:. Can I Really Do This? By: Carolyn Fiutem, MT, CIC APIC Chapter 26 9/7/09. Objectives:. Participant will be able to identify situations applicable for Performance Improvement (PI) Participant will describe the steps in the FOCUS-PDCA PI process

Scientific Poster:
E N D
Presentation Transcript
Scientific Poster: Can I Really Do This? By: Carolyn Fiutem, MT, CIC APIC Chapter 26 9/7/09
Objectives: • Participant will be able to identify situations applicable for Performance Improvement (PI) • Participant will describe the steps in the FOCUS-PDCA PI process • Participant will be able to describe the steps to convert PI projects to a scientific poster
Purpose of a poster… • Present information on current research that may not be totally complete • Present information on methods or observations that are the result of ongoing research • Problems can be discussed with peers • Methods can be adjusted to give optimum results
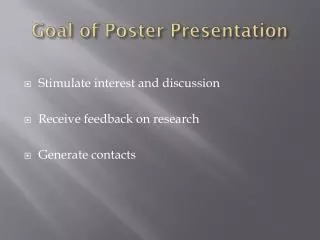
…is more than presenting data • Enables your contribution to a conference • Significant part of professional education • Provides information • Develops your experience • Builds networks and contacts • Incredible source of feedback
FOCUS-PDCA • Developed by W. Edwards Deming • Provides a model for improving processes • Acronym describes the basic components of the improvement process
FOCUS • Find a process to improve • Organize a team to work on the process improvement • Clarify current knowledge of the process • Understand/Uncover the process variation and/or root causes • Select a strategy for continued improvement
PDCA • a way of continuously checking your progress in each step of FOCUS process • Plan the process improvement • Do the improvement, data collection and analysis • Check the results and lessons learned • Act by adopting, adjusting, or abandoning the change
FIND – sources of improvement opportunities • Increasing rates of infection • Sentinel events • Closed record screens • M & M reports • Plaintiff claim allegations • Congressional inquiries • News media stories
FIND – the first step of our journey… • Our C. difficile rates continued to rise regardless of hand hygiene, precautions, identification of cases, environmental cleaning…. • What are others doing?... • Watched and thought…. • Researched and read… • And researched again…
FIND – a process to improve • Is there a clear, simple description of the process? • What is the process? • What are the major process problems? • What are the perceived boundaries? • What are the resources? • What are the key issues?
Organize… • Who are the people involved in the process? (internal/external customers) • A team that knows the process • Is there technical guidance and support available?
Organize…step 2 • Nursing (pt care floors, ED, OR, PACU, ONC, SDS) • PCAs • Physicians • Materials services • Administration
Clarify…current knowledge • Who are the customers? • What are their needs? • Should boundaries/limits be defined? • What is the actual process flow? • Is there needless redundancy/ complexity? • What are the outcomes/best way for the process to work?
Clarify…step 3 • No process in place for cleaning BP cuffs • Attempts to use wipes • Used EVERYWHERE on EVERYONE • In rooms on wall and Dynamaps • Research! • Other processes at other facilities?
Understand/Uncover – causes of process variation/poor quality • What are the major causes of variation or poor quality? • Which key characteristics are measurable? • What/who/where/when/how will data be collected? • Does the data reflect common or special cause? • Which causes of variation can we change to improve the process?
Possible tools to use… • Brainstorming • Cause and effect diagram • Inverse tree diagrams • Multi-voting • Scatter diagrams • Run & control charts • Histograms
Understand…step 4 • No workable way to disinfect current BP cuffs • Vinyl cuffs very expensive • No guarantee of partial or complete compliance with cleaning even with vinyl • Disposable BP cuffs available and economical • No reprocessing due to costs
Select improvement process or Start PDCA Cycle • Select a portion of the process to improve • What is the proposed process improvement • Write the Mission Statement/Goal • What changes to the process are most feasible?
Select…step 5 • Performed cost analysis • Performed force-field analysis • Proposed use of disposable BP cuffs • Received approval from Senior Leadership • Determined study time frame • Determined implementation steps • Determined final process
Plan – the improvement • What is the process improvement selected? • Who will do the pilot? • How will it be piloted? • Where will it be tested? • When will it be tested? • What data must be collected to measure improvement?
Do • Do the improvement, collecting and analyzing the data • How or will data collection efforts need to be amended? • Education • Communication
Do…step 6 • Implemented disposable BP cuffs Jan 1, 2005 • Lots of “doubting Thomases” • Lack of front-line management support • Continued using same definitions • Continued using same reporting mechanism • No other IC process changes
Check – the results…and lessons learned • Did the process improve as expected? • Did the process improve from a customer’s point of view? • Does the data support the improvement? • How could the team efforts be improved?
Check…step 7 • Results were 2X as good as expected • Use was noticed by patients and families • Nosocomial cases reduced by >50%
Act • To hold the gain • Adopt – our step 8 • Adjust • Abandon the change
Act • What parts of the improved process needs to be standardized? • Policies or procedures to be revised • Who needs to be made aware of the change? • What can be measured to ensure the gain is held? • What are the next steps in continuously improving this process?
Check – lessons learned (the hard way!) • Don’t make assumptions about the process without thorough follow-up! • Don’t be too trusting. • Never assume no one will change your process and not tell you! • Be prepared to defend your decision at any time. • Continuously review your process to identify new improvements
Goal is…. • Presenting a poster with - Impact!
Characteristics of an effective presentation… • Organized • Rehearsed • Visual appeal • Relevant to your audience • Demonstrates enthusiasm
Step 1 • Prepare and submit your abstract • Seek experts to help you • Determine the requirements, such as character limits and if spaces count! • Format choices, which one applies • Know the deadlines • Financial disclosures • Resolution of personal conflicts of interest
Title mistakes… • Title is too long. • Avoid cutesy. • Does not hew closely to the abstract’s purpose • Include abbreviations likely to be familiar to many readers • Using inappropriate humor
Abstract mistakes… • Too long and packed with too much detail • Incorrect format • Neglects to focus on the essential findings of the project • Includes extraneous material • Writing in a condescending manner
APIC Format I • For abstract involving scientific research • Randomized clinical controlled trials • Case controlled studies • Cohort • Observational • Experimental design • Disclose primary findings • No preliminary results
APIC Format I • Background/Objectives • Methods • Results • Conclusions
APIC Format II • Abstracts describing educational programs • Observations • Case studies • Outbreak investigations • Infection prevention or quality improvement activities
APIC Format II • Issue • Project • Results • Lessons Learned
Requirements • Title – character limit is 200 • Author – a short biographical summary of both the submitting author and presenting author (if not the same) • Character limit is 1000 • Abstract body – character limit is 2100 • Charts tables and graphs count as 150 characters toward the 2100 limit
Introduction mistakes… • Contains material that is unrelated to the paper’s findings • Lacks background information supporting the purpose of the project • Lacks a clear statement indicating the aim – what the author intends to establish • Contains data or findings that belong in other sections
Results mistakes… • Was statistical analysis best suited to the data utilized? • Inadequately reporting of the data • Unnecessarily duplicating data contained in the tables • Including material that belongs in the discussion section
Discussion mistakes… • Repeating text from the introduction • Neglecting to address how the findings relate to the practice of infection prevention & control • Reaching conclusions not supported by the project’s data • Failing to mention limitations or confounders of the study • Don’t be preachy or put in new information
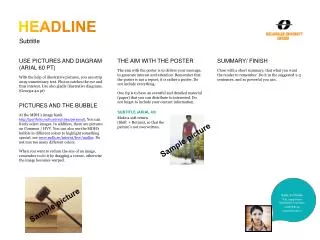
Step 2 • Develop and construct the poster • Components: • Title • Contributors & Affiliations • Abstract • Issue • Project • Results/Graphs • Lessons learned • References/Contact information
Organization & Visualization • Organize results and notes for easy access • Visualize how you’d like to present your results • Put quantitative results in a format to show relationships and can stand alone • Select an appropriate poster format • Be careful of designs and colors • Simple and straightforward is best
Assembly/Layout • Format size is important • Top to bottom and left to right • Legible from a distance of 3-4 feet • Labels and logic • Headers • Font size and style • Lay it out on the floor or a table • Best quality pictures – logos – graphs
Construction • Many programs available • Powerpoint one of the most common • Landscape format • Poster taller by increasing height • Poster longer by increasing width • Size can be dictated by printer you are using or the display space given
Construction • Begin by adding text boxes • Import pictures and graphs • Don’t forget to include legends • Leave adequate space as your border • Both around the poster and between columns • Spell check is your friend!