Particle Release Simulation in South and East China Sea Regions: 1997 & 2003
30 likes | 153 Vues
This project involves the release of 39,200 particles across designated regions in the South China Sea (SCS) and East China Sea (ECS) with depths less than 200m, divided into four runs: January 1997, July 1997, January 2003, and July 2003. Each run will create 3-year animations using colors to represent different regions. Time-series plots will analyze particle percentages entering various regions over the three-year period, contributing to the understanding of current dynamics and particle dispersion in these crucial marine areas.

Particle Release Simulation in South and East China Sea Regions: 1997 & 2003
E N D
Presentation Transcript
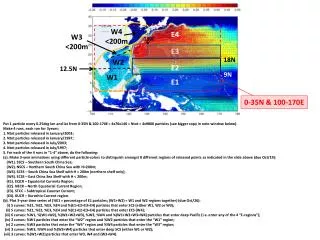
W4 <200m E4 W3 <200m 130E E3 18N W2 E2 12.5N 9N W1 E1 0-35N & 100-170E Put 1 particle every 0.25deg lon and lat from 0-35N & 100-170E = 4x70x140 = Ntot = 4x9800 particles (see bigger copy in note window below). Make 4 runs, each run for 3years: 1. Ntot particles released in January/2003; 2. Ntot particles released in January/1997; 3. Ntot particles released in July/2003; 4. Ntot particles released in July/1997; 5. For each of the 4 runs in “1-4“ above, do the following: (a). Make 3-year animations using different particle-colors to distinguish amongst8 different regions of released points as indicated in the slide above (due Oct/19): (W1). SSCS – Southern South China Sea; (W2). NSCS – Northern South China Sea with H>200m; (W3). SCSS – South China Sea Shelf with H < 200m (northern shelf only); (W4). ECSS – East China Sea Shelf with H < 200m; (E1). EQCR – Equatorial Currents Region; (E2). NECR – North Equatorial Current Region; (E3). STCC – Subtropical Counter Current; (E4). KUCR – Kuroshio Current region. (b). Plot 3-year time series of (%E1 = percentage of E1 particles; (W1+W2) = W1 and W2 regions together) (due Oct/26): (i) 5 curves: %E1, %E2, %E3, %E4 and %(E1+E2+E3+E4) particles that enter SCS (either W1, W2 or W3); (ii) 5 curves: %E1, %E2, %E3, %E4 and %(E1+E2+E3+E4) particles that enter ECS (W4); (iii) 6 curves: %W1, %(W1+W2), %(W1+W2+W3), %W3, %W4 and %(W1+W2+W3+W4) particles that enter deep Pacific (i.e. enter any of the 4 “E-regions”); (iv) 2 curves: %W1 particles that enter the “W2” region and %W2 particles that enter the “W1” region; (v) 2 curves: %W3 particles that enter the “W4” region and %W4 particles that enter the “W3” region; (vi) 3 curves: %W3, %W4 and %(W3+W4) particles that enter deep SCS (either W1 or W2); (vii) 3 curves: %(W1+W2) particles that enter W3, W4 and (W3+W4).
W4 <200m E4 W3 <200m 130E E3 18N W2 E2 12.5N 9N W1 E1 0-35N & 100-170E