Download
1 / 21
210 likes | 295 Vues
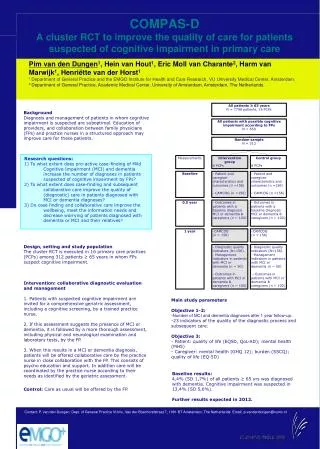
Explore spending allocation and teacher salaries in Arkansas compared to neighboring states and the nation, assessing equity in resource distribution by student demographics and examining athletics spending trends.

E N D
Research Questions • Overall Adequacy of Education Spending • How much is spent on education? • Where do education revenues originate? • Where do education dollars get spent? • How does spending in Arkansas compare to that in neighboring states and the nation? • How do teacher salaries in Arkansas compare to that in neighboring states and the nation? • Equity of Resource Distribution by Student Expenditures and Teacher Salaries based on: • District size • Percentage of low-income students • Percentage of minority students • Percentage of low-performing students • How much do districts spend for athletics?
Adequacy: How much is spent on education? How much is spent on education as a percentage of the state budget? Percent of Entire State Budget by Category of Spending Arkansas General Funds Distribution, Fiscal Year 2006-2007
Adequacy: Where do revenues originate? Per Pupil Revenue by Source from 2003-04 to 2006-07
Adequacy: Where is money spent? Per Pupil Expenditures by Function from 2003-04 to 2006-07
How does spending in Arkansas compare to that in neighboring states and the nation? Cost-of-Living AdjustedTotal Expenditures Per Pupil for Arkansas and Neighboring States from 1959-60 to 2004-05
How do teacher salaries in Arkansas compare to that in neighboring states and the nation? Cost-of-Living Adjusted Average Teacher Salary Comparison, 1970-2005 Have teacher salaries increased statewide?
Equity: Spending by District Size Current Expenditures by Average Daily Membership from 2003-04 to 2006-07 $122 $161 Small districts, < 554 ADM Large districts, > 2,440 ADM
Equity: Teacher Salaries by District Size Average Teacher Salary by Average Daily Membership from 2003-04 to 2006-07 $9,587 (-6%) $10,148 Small districts, < 554 ADM Large districts, > 2,440 ADM
Equity: Spending by Low-Income Students Current Expenditures by Percentage of Low-income Students from 2003-04 to 2006-07 +$2,090 +$1,454 < 45% FRL Students >71% FRL Students
Equity: Teacher Salaries by Low-Income Students Average Teacher Salary by Percentage of Low-income Students from 2003-04 to 2006-07 $3,621 (-11%) $4,050 < 45% FRL Students >71% FRL Students
Equity: Spending by Minority Students Current Expenditures by % of Minority Students from 2003-04 to 2006-07 +$2,144 +$1,639 < 3% Minority Students > 43% Minority Students
Equity: Teacher Salaries by Low-Income Students Average Teacher Salary by % of Minority Students from 2003-04 to 2006-07 +$4,297 $6,163 +$4,857 < 3% Minority Students > 43% Minority Students
Equity: Spending by Low-Performing Students Current Expenditures by % of Students Scoring Proficient or Better on Arkansas Benchmark Exam from 2003-04 to 2006-07 +$2,400 +$1,523 < 40% Proficient > 57% Proficient
Equity: Teacher Salaries by Low-Performing Students Average Teacher Salary % of Students Scoring Proficient or Better on Arkansas Benchmark Exam from 2003-04 to 2006-07 < 40% Proficient > 57% Proficient
Athletic Spending • According to the available data, districts, on average, spent $227 per pupil on athletics in 2005-06 and $270 per pupil in 2006-07. Approximately 3% of the current expenditures. • Data are unreliable based on Legislative Audit, which found that districts mis-reported on average by approximately 20%. • Future reports will clarify our understanding of where athletic spending occurs, and by district types.
Conclusions: Adequacy • Since 2003-04… • Total revenue allocated to K-12 education has increased from $3.45 billion to $4.48 billion. • Per pupil revenue has increased by 27% from $7,696 to $9,736. • The state share of education funding has increased from 49% to 53%. • Today in Arkansas, nearly 50 cents of every dollar raised by the state government is spent on K-12 education. Per pupil spending in Arkansas is now second only to that in Missouri of the neighboring states and is equal to the national average.
Conclusions: Equity in Spending • Smaller school districts have higher levels of per pupil spending, but this difference has decreased since 2003-04. • Districts with more low-income students spend more per pupil than do districts with fewer, and this difference has increased since 2003-04. • Districts serving large numbers of minority students spend more per pupil than do districts with smaller numbers, and this difference has increased since 2003-04. • Districts serving low-performing students spend more per pupil than do districts serving high-performing students, and this difference has increased since 2003-04.
Conclusions: Equity in Teacher Salaries • Compared to neighboring states and the national average, Arkansas teacher salaries have improved dramatically over the previous ten years. • Larger districts pay higher salaries than do smaller districts, but this difference has decreased since 2003-04. • Districts serving high numbers of low-income students pay lower salaries than do those serving fewer low-income students, but this difference has decreased since 2003-04. • Districts serving large numbers of minority students pay higher salaries than do districts serving mostly white students, but this difference has decreased since 2003-04. • Districts serving academically-struggling students pay higher salaries than do most other districts in the state, but this difference has decreased since 2003-04.
Summary and Implications • Historically, Arkansas neglected to provide enough resources for an adequate education. • The additional resources since 2003-04 have done much to fix this problem. • Historically, Arkansas has provided an equitable distribution of resources. • Since 2003-04 policymakers passed specific legislation to provide more funds to disadvantaged students. • The goals of Lake View seem to be met. • Where do we go from here? • Athletic spending questions • Questions remain about school level spending • Are resource increases associated with improvements in performance