Graphing Earnings and Choices: A Comprehensive Assessment of Jobs, Spending, and Creativity
120 likes | 240 Vues
This assessment explores various topics related to graphing, algebra, and real-world applications. Students will create graphs representing earnings over a year for different jobs, analyze median wages, and describe emotional levels of fairy tale characters through graphical representation. The project involves comparing cell phone and movie rental plans based on cost analysis while summarizing choices. Creativity is encouraged through a stained glass art project, leading to a deeper understanding of linear equations, graphing, and real-life budgeting scenarios.

Graphing Earnings and Choices: A Comprehensive Assessment of Jobs, Spending, and Creativity
E N D
Presentation Transcript
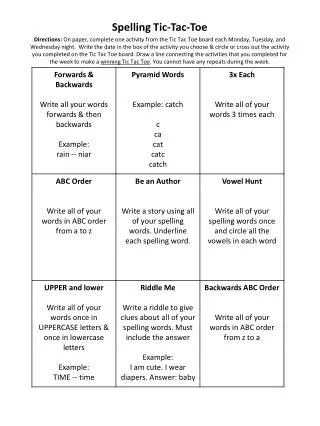
Tic-Tac-Toe Linear Equations Algebra 2 30 Assessment Points
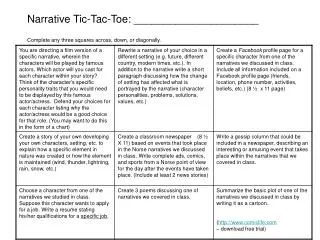
2 Jobs of Interest Describe Graph the Earnings for 1 Year Write Equation Summary - Why choose one job over another?
Jobs Example • Military Pay Grades • Median Weekly Wages by Occupation
Eating Out • Mean spent by 10 people (include names/$) • Graph for a year • Paragraph Summary
Calculator Picture Graph • Create a picture that can be graphed on a graphing calculator. • Show the teacher. • Original Work • Mario Mushroom • Mickey Mouse • Numerous Pics
Line Picture • picture using at least 10 line • no more than 2 having identical slope • pictures on bulletin board outside classroom
Emotional Graph Fairy Tale • Graph Emotional Level of Fairy Tale Character • Label equation of the graph in y = mx+b • Your graph must have at least 10 lines
Cell Phone Plans • graph 2 different cell phone plans • Overage charges for additional minutes, texting, or data use. • Summarize why you would choose one over another.
Entertainment • Mean spent by 10 people (include names/$) • Graph for a year • Paragraph Summary
Movie RentalPlans • graph 2 different movie rental plans • Summarize why you would choose one over another. Example: Blockbuster $2.99 first day + 999 cents each additional day Redbox $1/day
Stain Glass Art Project • Create a stained glass window • Use at least 10 lines. • Write the equations of the lines used.