Download
1 / 25
250 likes | 598 Vues
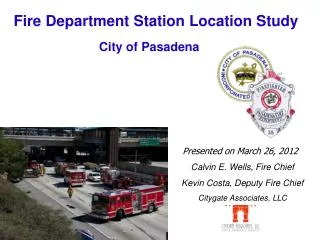
San Marcos Fire Station Location Analysis. Andrea Nieto, Bryan Heisinger, Nadine Oliver Matthew Mitchell. Introduction. Summary. According to the United States Census Bureau, between 2010 and 2011, San Marcos experienced a 4% increase in population, reaching more than 45,000 people.

E N D
San Marcos Fire Station Location Analysis Andrea Nieto, Bryan Heisinger, Nadine Oliver Matthew Mitchell
Summary • According to the United States Census Bureau, between 2010 and 2011, San Marcos experienced a 4% increase in population, reaching more than 45,000 people. • To meet the demand of this growth trend, the City of San Marcos is proactively developing a plan to construct a new fire station.
Purpose • The purpose of this study is to determine potential locations in San Marcos where the economic and demographic conditions of the area justify the construction of a fire station. • We will consider the following factors: parcel area, parcel value, day/night time population, square footage of buildings, value of improvements, conflagration potential and wildlife urban interfaces.
Scope • San Marcos, Texas is approximately 30 square miles and contains about 1500 people per square mile (United States Census Bureau). • Our research will consist of analyzing 11 grid cells that have been pre-determined by the City of San Marcosand do not contain a fire station. • The shape of the grid cells have been derived from a similar study that published by the City of Austin.
An Equation for Station Location • Objective: Determine areas of Austin, Texas that demonstrated a need for future fire stations. • Fire Chief Bill Roberts developed a diamond-shape grid system to delineate emergency fire service areas. • Factors included: -distance from existing stations -fire frequency of the area -development patterns -population distributions -taxable improvements -square footage of structures • Sybesma, Pieter. (1995). An Equation for Station Location. Fire Chief Oct. 1995: 55-65. Print.
Urban Conflagrations:Strategy and tactics applied to large area fires in urban areas This article describes in detail factors associated with urban conflagration and provides case-study examples of past urban area fires. • Factors: • closely built structures; • wildland/urban interfaces • the use of untreated wood shingles as exterior covering for roofs or walls; • poor water supplies, weaknesses in automatic or manual fire suppression systems; • dilapidated structures, especially abandoned buildings in large numbers; • large-scale combustible construction or demolition projects; • built-up areas near high-hazard locations, • Klaene, B., & Sanders, R. (2008). Urban conflagrations. NFPA Journal, 102(6), 28-28,86. Retrieved from http://www.nfpa.org/publiccolumn.asp?categoryid=1693&itemid=40848&src=nfpajournal&cookie_test=1
Locating fire stations: An integrated approach for Belgium • Funded by the Belgium Ministry of the Interior to assess the need for improving and optimizing fire station locations • Used a risk modeling and location-allocation approach to determine the lowest-cost option for ensuring 90% of fires can be reached within a specific time frame. • Factors: -past fire incidences -census data -road networks -intervention rules and norms • Similar objective, but different in its scale and approach. Fig. 4. Estimated density of fires in dwellings (number of fires per year and per square kilometer). Note: between brackets: number of communes in each interval. • Chavalier, Phillippe, and Isabelle Thomas. "Locating Fire Stations: An Integrated Approach for Belgium." Socio-Economic Planning Sciences 46 (2012): 173-82. Retrieved from http://www.sciencedirect.com/science/article/pii/S0038012112000080
Data Needed • City grid composed of cells • Parcels layer of the City of San Marcos • A buildings layer • Tax roll spreadsheet • Parks Layer *All data has been provided by the City of San Marcos*
Methodology cont. • Parcel Area (developed/undeveloped) • Parcel Value • Population (day/night) • Building Sq. Footage • Value of Improvements • Wildlife and Urban Interface
Conflagration Index Purpose: create an index to compare the likelihood that a fire will spread from one structure to another in a given area. Factors and Weights • Proximity of buildings to each other (5) • Wildland/Urban interface (3) • Frequency of buildings three stories in height or greater (2) The combination and weights of these factors we believe will reasonably gauge the potential an area has for conflagration. It will also be able to be used as a basis of comparison between areas as a factor for our broader analysis.
Implications Short term: • Assist in educating policy makers with decisions regarding the expansion of the San Marcos Fire Department. • Aid the Fire Department by providing them with a detailed report regarding the characteristics of the area they service. Long term: • Preemptively determining the siting of future fire stations will allow the city services to accommodate predicted population growth trends and provide the best possible service to its citizens.
Total Cost • $19,010.25 Budget Breakdown
Final Deliverables Upon completion of the project, we will present the City of San Marcos and the Texas State University Geography Department with a poster, a website, and a CD of our final analysis which will include the following documentation: • All data used • Metadata • PowerPoint highlighting our final analysis • Final Report • Map (or map book) of each grid cell • Spreadsheet containing all statistics that were calculated through analysis • Summary of project explaining methodology • Electronic Data Copy (CD)
Conclusion The result of this project will provide the City of San Marcos with an organized and efficient database of factors. This is needed to justify the cost of construction as well as help plan for future fire stations accordingly. The City of San Marcos can potentially use our project and expand upon our maps and models to meet their evolving needs as the city grows.