Association of Baseline Proteinuria with Risk of Renal Events: A Propensity Score Analysis
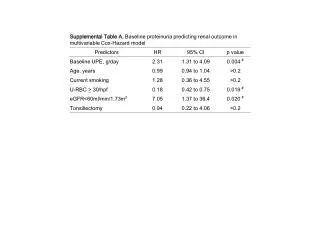
This study explores the relationship between baseline urine protein excretion (UPE) and the risk of subsequent renal events. Using logistic regression models, we estimated propensity scores for UPE at one year, revealing significant adjustments based on baseline clinical predictors. The results indicated a risk ratio for renal events related to baseline UPE levels, demonstrating how proteinuria impacts renal outcomes over time. The implications for early intervention and management of patients with proteinuria in clinical settings are discussed.

Association of Baseline Proteinuria with Risk of Renal Events: A Propensity Score Analysis
E N D
Presentation Transcript
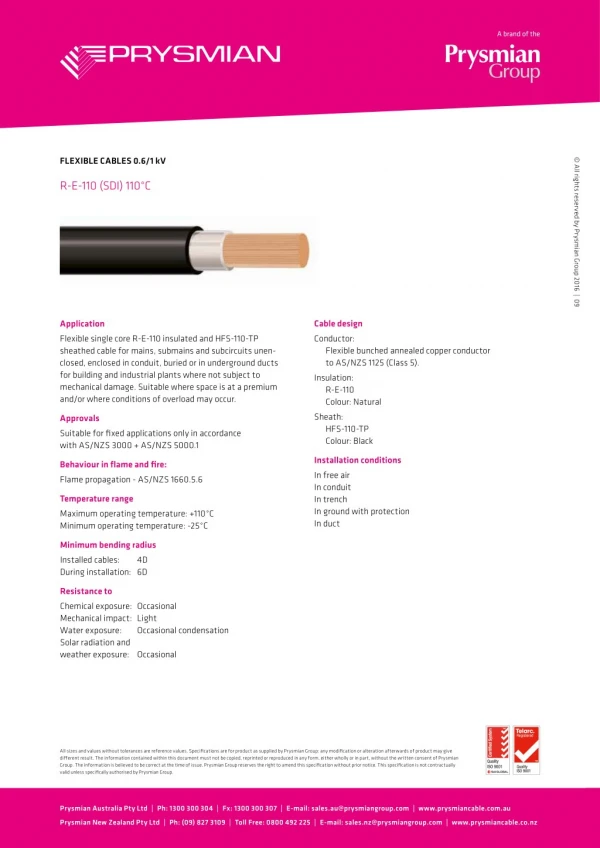
Increase 1.2 Risk 1.0 Mean Lower or upper of 95% CI 0.8 Riskratio for renal events Reduction 0.6 0.4 0.2 0 0.6 0.8 1.0 1.2 1.4 1.6 1.8 2.0 UPEat baseline, g/d Supplemental Figure A.Risk ratio for the end point associated with the baseline UPE Plots of the risk ratios and 95% confidence intervals (CI) adjusted for the baseline eGFR for the endpoint using the level of baseline proteinuria examination as the continuous variable were shown (reference; the highest quartile, the median of which was 2.34 g/day). The degree of proteinuria was log transformed.
Propensity score for UPE at one year < 0.4 g/day = 1.605 + 0.023 x Age (years) - 1.097 x UPE at baseline (g/day) eGFR<60 ml/min/1.73m2 - 0.161 for “Yes” +0.161 for “No” U-RBC >30 /hpf +0.645 for “Yes” - 0.000 for “No” Tonsillectomy - 0.107 for “Yes” +0.107 for “No” Current smoker +0.071 for “Yes” - 0.071 for “No” Sex - 0.011 for “female” +0.011 for “male” BP > 130/80 mmHg +0.345 for “Yes” +0.345 for “No” RAAS inhibitors +0.037 for “Yes” +0.037 for “No” + + + + + + + Supplemental Figure B.An equation of propensity score for UPE at one year <0.4 g/day with baseline clinical predictors The propensity score was estimated by logistic regression model for UPE at one year < 0.4 g/day (Nagelkelke R square was 0.268, p<0.001).
Propensity score for UPE at one year < 0.4 g/day = 2.257 -0.992 x UPE at baseline (g/day) - 0.078 for “T0” - 0.459 for “T1” +0.537 for “T2” +0.000 for “E0” +0.942 for “E1” +0.004 for “S0” - 0.004 for “S1” +0.192 for “M0” - 0.192 for “M1” + + + + Supplemental Figure C.An equation of propensity score for UPE at one year <0.4 g/day with Oxford classification and baseline UPE The propensity score was estimated by logistic regression model for UPE at one year < 0.4 g/day (Nagelkelke R square was 0.269 p<0.001).
Propensity score for UPE at one year < 0.4 g/day = 2.314 - 0.821 x UPE at baseline (g/day) HG +0.000 for “HG 1” +0.890 for “HG 2” - 0.535 for “HG 3” + Supplemental Figure D.An equation of propensity score for UPE at one year <0.4 g/day with HG and baseline UPE The propensity score was estimated by logistic regression model for UPE at one year < 0.4 g/day (Nagelkelke R square was 0.271 p<0.001).
0.40 g/day True positive 1.00 0.90 0.69 g/day 0.80 0.70 UPE at one year, g/day 0.60 0.50 0.40 False positive 0.30 0.20 0.10 0.00 0.00 0.20 0.40 0.60 0.80 1.00 Supplemental Figure E. ROC analysis for renal outcome by UPE at one year
Increase 1.6 Mean Lower or upper of 95% CI 1.4 Risk 1.2 Riskratio for renal events 1.0 Reduction 0.8 0.6 0.4 0.2 UPEat one year / UPE at baseline 0 0.05 0.1 0.2 0.4 0.6 0.8 Supplemental Figure F. Risk ratio for the end point associated with the improvement of proteinuria (UPE at one year/ UPE at baseline).