Occupational Road Safety
Occupational Road Safety. A South African Utility Experience Jace Naidoo. Content. Introduction to Eskom The state of road safety in South Africa Road Safety in Eskom Taking up the challenge Case study on Coal Transport. Introduction.

Occupational Road Safety
E N D
Presentation Transcript
Occupational Road Safety A South African Utility Experience Jace Naidoo
Content Introduction to Eskom The state of road safety in South Africa Road Safety in Eskom Taking up the challenge Case study on Coal Transport
Introduction A utility which generates over 90% of South Africa’s electricity Transmission and significant portion of Distribution. Network of approximately 350 000km of power lines Generation capacity of over 42 000 MW and increasing 100% State owned entity which also owns various electricity support companies which include engineering maintenance, civil construction, and heavy duty road transport including managing the transport of coal to the fleet of coal power stations around the country.
General Features Nominal capacity – 42 011 MW Power lines (all voltages) – 347 204 km Coal burnt – 140 Mt (approximately 56Mt transported by road) Employees > 33 000 Customers – 3 603 943
Plant Mix TYPE NUMBER NET MAX CAPACITY Coal fired 13 stations 32 066 MW Gas turbine 2 stations 342 MW Hydroelectric 6 stations 600 MW Pumped storage 2 stations 1 400 MW Nuclear 1 station 1 800 MW TOTAL 24 STATIONS 36 208 MW
International Comparisons Sales Rating Country TWh by sales RAO-UES Russia 636 1 EDF France 473 2 E.On. Germany 404 3 KEPCO South Korea 294 4 TEPCO Japan 281 5 RWE Energie AG Germany 230 6 Eskom South Africa 206 7 Vattenfall Sweden 186 8 Eletrobras Brazil 178 9 Hydro Quebec Canada 169 10 Taiwan Power (TaiPower) Taiwan 159 11 Enel Italy 156 12 TVA USA 155 13 Kansai Electric Power Co. Japan 142 14 Electrabel Belgium 137 15 Endesa Spain 134 16 Chubu Japan 123 17 AEP USA 118 18 AES USA 108 19 USA 103 20 FPL Company
International Comparisons RAO-UES Russia 156 600 1 EDF France 122 600 2 Tepco Electric Power Co Japan 62 660 3 E.On Germany 54 000 4 KEPCO Korea 50 432 5 Enel Italy 47 000 6 AES USA 46 000 7 RWE Energie AG Germany 45 000 8 Endea Spain 43 000 9 Eletrobas Brazil 40 854 10 Eskom South Africa 39 810 11 Southern USA 39 000 12 Duke USA 38 748 13 Exelon USA 38 000 14 AEP USA 36 000 15 Kansai Electric Japan 35 434 16 Hydro Quebec Canada 34 000 17 Taiwan Power (TaiPower) Taiwan 33 290 18 TVA USA 33 189 19 Vattenfall Sweden 33 000 20 Generation capacity MW Rating by capacity Company Country Source: Data Monitor UK 2004 figures
South African data? Data limited, but half a million road accidents per annum: 10,000 deaths (iafrica), or could be 15,000 (Medical Research Council, 2003) About a quarter of all non-natural deaths in SA 150,000 injuries 3rd worst stats in Africa Legal BAC of .05 exceeded in 46.5% of SA road fatalities (National Dept for Transport, 2003) Seatbelt compliance – 40% (50% front, 10% rear) (AA) Speed, fatigue and rule compliance are also major factors 6.9 million vehicles, more than half are cars, owned by 10% of 45 million population 26.5 (20.9) deaths per 100,000 population – UK = 6 Road accidents cost the South African economy an estimated R581bn ($78bn) between 1996 and 2006, according to a report by the country's Department of Transport.
South Africa Roads South Africa's total road network is about 754 000 kilometres, 9 600km of which are surfaced national roads. The drive from Musina on South Africa's northern border to Cape Town in the south is a 2 000km journey on well-maintained roads. Around 2 400km of the roads in the country are toll roads. While the Department of Transport is responsible for overall policy, road-building and maintenance is the responsibility of the South African National Roads Agency as well as the nine provinces and local governments. Extensive national legislation and agencies for managing road traffic exists in South Africa
Road Risk – some facts Vehicles in business (all categories) more than 10 000 Distances driven annually aprox 250m Km Approximate number of annual accidents (excl. contractors) 10 000 Approximate annual costs (excl medical care and benefits) >R132m
People at Risk Eskom employees in their day to day duties Transportation of employees and contractors to various workplaces Contractors transporting materials and supplies Construction vehicles
Managing the Risk Clear Policy Employers responsibility Clear safety specifications for all types vehicles: Air bags, ABS brakes, safety belts, etc Discipline Cardinal rules Substance abuse Seat belts
Eskom – policy requirements Driver: Risk assessment for each driver Awareness programmes Certified as medically fit Provide driver training A valid national driver's licence as well as an eskom driver permit Drivers and passengers wear seatbelts Vehicles: Complies with the eskom vehicle safety specifications Ensure that all vehicles are maintained in A roadworthy condition; Install Vehicle monitoring device Not allowed to be transported in the back of open vehicles. No person may be transported in the back of closed vehicles unless provided with proper seating and safety belts. Investigate all work-related incidents and take appropriate action
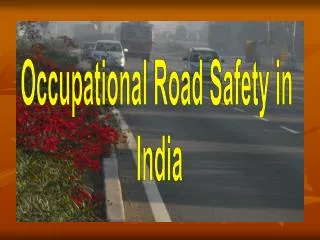
Transporting Coal An emerging risk
Changing environment Historically power stations close to mines Coal transported by conveyors Limited road transport – done by mines Risk managed by mines Excess generation capacity in the country Last few years rapid growth in country and world Electricity demand Coal demand globally Decisions on restructuring industry led to delays in deciding on new generation capacity Greater demand on existing stations
Impact of the growth Capacity of mines Need to increase road transport Eskom contracts road transport companies Limited experienced drivers available Limited investment on road infrastructure in the country Transport of coal – negative impact on roads
Managing the risk - The Approach Reduce number of coal trucks on the road Actions to restore safety culture with current trucks
CURRENT SITUATION 30.3 Planned short-term buying Emergency short-term buying Coal transported by road Mtpa Current situation • Increased current coal transport by road because of • Increased burn at power stations • Reduced supply from tied collieries • Need to replenish stockpiles (+20 day level) • Limited current rail transport of coal (only ~4.4 Mtpa to Majuba) • 40% of the forecasted coal delivered to Eskom in the next 12 month will be by road; an increase from 22% in the previous year 57.2 56.1 • Increased accidents on roads (year to date: at least 24 fatalities and 200 recorded accidents related to coal trucks**) • Increased risk to the security of supply due to deteriorating road conditions (50% reduction in road deliveries in 18-24 months*** will result in load losses of up to ~10% of installed capacity) 26.9 25.2 07/08* 08/09 09/10 Based on Eskom’s current forecast of short term coal purchases * Financial year ending Mar ’08 ** Current data only available for FOT coal deliveries, which is ~30% of total coal deliveries *** Rotran estimate based on reported tonnages on road until May 2008 and current road conditions Source: Coal Logistics team; Eskom Primary Energy rainbow sheets; Long-term coal strategy; Rotran
THE CURRENT SCALE OF COAL ROAD TRANSPORT IS UNPRECEDENTED 873 • Over the next 12 months, ~150 000 tons (5100 truck-loads) of coal will be transported daily, using ~ 1300 km of roads • Every day, these trucks go the equivalent of one truck travelling 15 trips around the world • Total fuel consumed for these trucks is approximately 200 million litres (>2% of SA diesel consumption) • Total of ~3100 trucks used to transport coal is unprecedented in SA; equivalent to 10% of Federal Express’s total fleet in USA
PROJECTS TO REDUCE TRUCKS ON ROAD Truck Optimisation Destoning Rail options Conveyors Road Construction Mine Options 30
550 PROJECTED IMPACT OF COAL TRUCK REDUCTION PROJECTS Estimated daily coal truck deliveries to power stations* In addition to these actions, the current roads need to be repaired, upgraded and maintained for the remaining truck traffic 5 100 4 280 1 480 2 800 2 250 Current total for all power stations Potential short-term reductions 2009/2010 Potential mid-term reductions 2011-2013 Implementing long-term strategy 2018 onwards • rail optimisation could remove 420 daily truck-loads • Supplying open cast colliery will remove 135 truck-loads • Optimising the current trucking system to maximise the legal payload per truck and minimise empty km’s, could remove ~300 truck-loads from the roads • The new Ermelo-Majuba rail link could remove the remaining truck delivery to (~450 truck-loads) • Rail transportation of coal to xxx could remove another 270 • De-stoning coal before transporting it by truck could remove 130 daily truck-loads • Between 500 and 800 truck-loads per day to XXX could be removed by a long-distance conveyor or rail • Implementing Eskom‘s long term strategy will result in new conveyor and rail links, minimising road transport (e.g. it includes linking Waterberg coal fields by rail) • After stockpiles are replenished, emergency buying will probably cease, significantly reducing remaining coal truck-loads * Assuming 30 ton trucks loads, 365 days per year; cumulative effects approximated Source: Coal Logistics team
Main problems identified • Safety belts • Speeding • Drink & drive • Driver fatigue • Overtaking • Following distance • Overloading • Truck & Trailer conditions • Unauthorized routes • Unauthorized passengers Lack of safety culture
SAFETY PLAN • Implement cardinal rules • Central control • Contractor control • Standards and sharing (Including training & briefings) • Monitoring & law enforcement • Improve road conditions • RTMS implementation
Cardinal Rules No speeding No overtaking Buckle up Sober up No overloading Vehicle fit for purpose
Central Control Centre • Safety needs to start at planning and contracting phase • Central authority to ensure standardised approach AND control processes • Starting point is standardised safety pack and contractors packs, linked with verification before start • Mines & power stations support and commitment to implement • Set base standard and continuous briefing process to implement and sustain safety awareness • Central point to authorise start of work as well as control work
CONTRACTOR CONTROL • Pre screening and compliance • Stop sub contracting on sub contracting • Contractor packs and contractor training, before driver inductions • Payment processes to drivers – must support safety and not just profit • Incentives and penalities
STANDARDS, TRAINING & SHARING • Apply same standards from start on all transporters, Including mines • Centralised induction and training program • Look at means to discontinue night time driving
Increased Monitoring • Need constant checking and law enforcement • Historically little action by Eskom and mines – Must change Eskom approach • “Bobby on the beat” approach to support standards, training and control centre (Specific dedicated coal road blocks on a continuous basis • Strategic partnership with Provincial Law Enforcement (Sponsor traffic officers to work in coal) • Use of electronic technology (RFID and Orchid tracking)
Road Conditions • Invest in improving roads • Engage with national treasury for funding • Partnership with provincial governments
Consists of three sets of standards: • Haulier Standards ARP 0067-1:2007 • Consignee Standards ARP 006-3:2007 • Consignor Standards ARP 067-2:2007
Implementation of the RTMS Standards can be broken into: • Overload control ( rules 1-3) • Safety and related elements ( rules 4 -10 )
RTMS Standards for Hauliers • Overloading related requirements • Rule 1: maintain an inventory of nominated vehicles and their legal carrying capacities • Rule 2/3: assess the vehicle mass before each laden trip Safety related requirements Rule 4: maintain vehicles in a roadworthy condition Rule 5: ensure vehicle and load safety Rule 6: manage driver wellness Rule 7: provide training and education Rule 8: assign tasks and responsibilities Rule 9: keep records and documentation Rule 10: perform an internal review (self-audit)
Recommendations to improve safety culture • Establish a Safety Steercom for road transport of coal, inclusive of the mines, transporters and Government • Establish a central control centre for all Eskom road transport of coal, responsible for standardisation, central authority and data management • Continue with the implementation of RTMS as well as the Loading pilot project • Increase the monitors to report and monitor coal trucks • Conclude a partnership agreement with Provincial Government regarding law enforcement provision of traffic officers • Extend the Tracking systems to all vehicles and in the Safety Steercom investigate the roll out to all transporters
Conclusion • Eskom is a major player in the SA economy • As a major road user – individuals, passengers and transport - as an impact on injuries and economic costs • Managing the risks contributes to the overall impact of improving the safety culture on SA roads • Create partnerships with government, other companies