Download
1 / 19
190 likes | 309 Vues
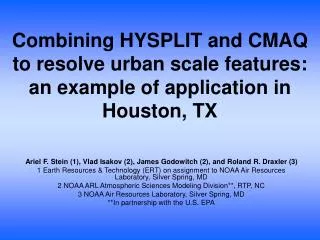
Combining HYSPLIT and CMAQ to resolve urban scale features: an example of application in Houston, TX. Ariel F. Stein (1), Vlad Isakov (2), James Godowitch (2), and Roland R. Draxler (3) 1 Earth Resources & Technology (ERT) on assignment to NOAA Air Resources Laboratory, Silver Spring, MD

E N D
Combining HYSPLIT and CMAQ to resolve urban scale features: an example of application in Houston, TX Ariel F. Stein (1), Vlad Isakov (2), James Godowitch (2), and Roland R. Draxler (3) 1 Earth Resources & Technology (ERT) on assignment to NOAA Air Resources Laboratory, Silver Spring, MD 2 NOAA ARL Atmospheric Sciences Modeling Division**, RTP, NC 3 NOAA Air Resources Laboratory, Silver Spring, MD **In partnership with the U.S. EPA
Motivation • Resolving urban scale features is critical for air toxics modeling and exposure assessments. • 3D Eulerian models are not designed for fine scale applications. Even at 1x1 km resolution we are pushing the limits of this approach. Very resource intensive. • Objective: to test the feasibility of developing an urban hybrid simulation system • In this example, CMAQ provides the regional background concentrations and urban-scale photochemistry, HYSPLIT provides the spatially resolved concentrations due to stationary emission sources, and AERMOD – from mobile sources. • In this first application, the HYSPLIT, AERMOD and CMAQ models are used in combination to calculate high resolution Benzene concentrations in the Houston area. The study period is from August 22th to September 3rd of 2000. • Furthermore, multiple HYSPLIT simulations with varying model inputs and physical parameters are used to create a concentration ensemble to estimate the concentration variability. Health assessment and exposure models.
Choosing models • Looking for the appropriate tools to handle different scales. • Regional scale: 3D Eulerian models with full chemistry CMAQ • Local scale: • Lagrangian models (simple or no chemistry) HYSPLIT (concentration variability) • Plume dispersion models AERMOD • To avoid double counting: zero out approach
HYSPLIT concentration variability • Exploring two sources: • Dispersion: created by different particle trajectory pathways in the turbulent atmosphere. 27 members, in which the particle trajectory variability in HYSPLIT is calculated by using a different seed number to estimate the random component of the particle diffusion. • Transport: different flow regimes that might be introduced when using gridded data to represent meteorological data fields. 18 members created by shifting the position of the meteorological field variables.
Advection and Dispersion • X(t+Dt)=Xmean(t+Dt)+U'(t+Dt) Dt, • U'(t+Dt)=R(Dt) U'(t)+U"( 1-R(Dt)2 )0.5 , • R(Dt)=exp(-Dt/TLx), • U"=su l, where U’ is the random velocity component, Xmean is the original position due to only advection by the mean winds, R is the turbulent velocity autocorrelation, su is the standard deviation of the turbulent velocity, and l is a computer generated random number with 0 mean and s of 1. Additional terms to account for gradients in the turbulent velocity near the ground are required for vertical particle dispersion. The growth of the particle distribution, or the “puff” mode, is represented by a much simpler formulation, where the growth rate of the horizontal standard deviation of the particles is given by • dsh/dt = (2 su)0.5 The dispersive growth rate for particles or puffs is controlled by the standard deviation of the turbulent velocity. • su = (Kx / TL)0.5 where K represents the turbulent diffusivity and TL a constant Lagrangian time scale. For vertical turbulence and within the boundary layer K is a function of height and surface stability. Above the boundary layer it depends upon the local stability, a ratio of the wind shear and thermal stratification. Horizontal turbulence is computed from the deformation of the wind field.
Modeling domain: Houston, TX Monitors Stationary sources Census tract centroids Major roads 36 km x 36 km area Benzene emissions HYSPLIT: Top six point sources ~60% emissions in Harris County AERMOD: 330 road links in 36x36 km area ~25% of all on-road benzene emissions in Harris County
Models settings • The study period is from August 22th to September 3rd of 2000 • All models driven by MM5 meteorology • Emissions based on 1999 National Emission Inventory • CMAQ: • For the CMAQ domain with 36-km grid cell spacing: • 45 columns x 46 rows with 24 vertical layers • Layer 1 ~ 38 m thickness • Central Houston/Harris County is covered by grid cell: column16, row 14 • Boundary conditions: tropospheric “clean” background • Benzene emissions from “local” emission sources being treated by the dispersion models were removed from the Houston 36-km cell to avoid a “double-counting” situation. • For the CMAQ domain with 1-km grid cell spacing: • 108 x 108 with 24 vertical layers • Layer 1 ~ 38 m thickness • Boundary conditions from 12, 4 km nests • General Model Configuration: • SAPRC99 photochemical mechanism + toxics chemistry, includes benzene • Euler Backward Iterative (EBI) chemistry solver
Models settings (cont.) • HYSPLIT: • 5000 3D lagrangian particles released • No chemistry • Meteorological fields calculated with MCIP2ARL preprocessor • Horizontal resolution : 0.01x 0.01 degree (1x1 km2 horizontal resolution) • AERMOD: • No chemistry • Meteorology: Hourly surface observations from the nearest NWS meteorological station at George Bush Intercontinental Airport (IAH), and vertical profiles from the Lake Charles upper air station, processed by AERMET • Emissions: 330 road links modeled as area sources in 36x36 km2 area ~25% of all on-road benzene emissions in Harris County • Receptors: 38 x 31 receptor grid, 1178 receptors total (consistent with HYSPLIT: 0.01 degree spacing, 29.65 – 29.95 deg. Lon, 95.14 – 95.51 Lat).
Benzene concentrations [mg/m3] from HYSPLIT (point sources only) daily average, 08/22/2000
Variability (std) in benzene concentrations [mg/m3] from HYSPLIT, 08/22/2000
Benzene concentrations [mg/m3] from HYSPLIT (point sources) and AERMOD (mobile sources) daily average, 08/22/2000
Benzene concentrations [mg/m3] from 1km x 1km CMAQ, daily average, 08/22/2000
Comparison with observations blue dots – combination: HYSPLIT + AERMOD + CMAQ green dots: CMAQ 1km x 1km resolution black lines: CMAQ only (36km)
What about “double counting”? Comparison with observations blue dots – combination: HYSPLIT + AERMOD + CMAQ (zero out approach) green dots: CMAQ 1km x 1km resolution black lines: CMAQ only (36km)
Sensitivity test (to check double counting) blue dots: HYSPLIT + AERMOD + CMAQ (zero out approach) purple dots: HYSPLIT + AERMOD + CMAQ (with double counting) black lines: CMAQ only (zero out approach) Conclusion: Double counting doesn’t seem important in this case
More analysis – scatter plots blue dots: HYSPLIT + AERMOD + CMAQ (hybrid approach, OAQPS) purple dots – combination: HYSPLIT + AERMOD + CMAQ (with double counting) Green dots: CMAQ 1km x 1km
Analysis of variability from HYSPLIT ensemble runs • light-blue circles: • variability due to meteorology • red squares: • variability due to dispersion • black triangles: • variability due to vertical structure • Standard deviation ~ mean concentration • Vertical variability gives lowest concentrations • Dispersion ensemble gives highest concentrations
Conclusions • A new method to resolve fine scale has been applied to a case study in Houston, TX. • Local scale modeling is necessary to resolve fine scale (for pollutants such as benzene, when local contributions are significant) • Spatially resolved hybrid approach is comparable with advanced CMAQ applications 1km x 1 km • Even 1km x 1km is not enough to reveal hot spots