Download
1 / 18
180 likes | 198 Vues
This presentation by the Metering Issues Taskforce discusses the impact of eliminating manual Time Error Corrections on Wholesale Settlements. It covers topics such as the definition and nature of Time Error, manual corrections, and the potential benefits of synchronization with NIST clocks. The analysis includes scenarios with different loads, delays, and price levels, outlining the requirements for accuracy in ERCOT metering protocol. The presentation showcases the effects of Time Delays on Demand Responsive Load and Price levels, stressing the importance of precise clock synchronization for efficient settlements in the energy industry.

E N D
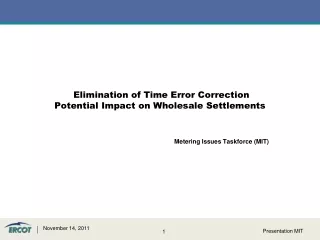
Elimination of Time Error Correction Potential Impact on Wholesale Settlements Metering Issues Taskforce (MIT) Presentation MIT
Background • NERC Operating Committee (OC) directed the Resources Subcommittee (RS) to develop a field trial to eliminate manual Time Error Corrections • What is Time Error? • Difference between NIST time and a clock driven by frequency • If average frequency is 60Hz, Time Error will be zero • If frequency is 0.01Hz high (low), a clock will gain (lose) 0.6 seconds an hour • What are Manual Time Error Corrections ? • Minor coordinated adjustments to frequency • One Reliability Coordinator in each Interconnection is designated “Time Monitor” • ERCOT Nodal Operating Guide Section 2.2.9.1 deals with time error • When time error is equal to or greater than ±3 seconds, ERCOT may initiate a time correction • Correction may end when error is less than ±0.5 seconds or when system events mandate termination • Time correction may be postponed if it is determined that load patterns in immediate future will result in desired time correction Presentation MIT
Impact of Elimination of Time Error Correction on Wholesale Settlements • Assume that ERCOT Polled Settlement (EPS) meters will be synchronized with NIST clock • Potential effect on wholesale settlements is analyzed for following: • Flat load • Price responsive load and/or demand responsive load • Different MW load connected to the IDR meter-100 to 1150 MW • Different delays (lag and lead)- 15 sec, 30 sec and 45 sec • Different price levels- $200 to $3000 /MWH • Aggregate IDR load in grid • Maximum allowed time error according to ERCOT Nodal Protocol 10: Metering • For TDSP meters: ±5% of settlement interval (15 min) or 45 sec of NIST clock • For EPS meters : ±1% of settlement interval (15 min) or 9 sec of NIST clock • ERCOT production servers are maintained within ±1 sec of NIST clock • Wholesale price calculations synchronized within ±1 sec of NIST clock for each settlement interval • No analysis conducted for retail settlements • Results contingent on contracts and specific load characteristics Presentation MIT
Price/Demand Responsive LoadIDR slower than NIST clock by 30 sec, 150 MW load -Delayed IDR Clock -NIST Clock Interval 1 Interval 2 Interval 3 Interval 4 Interval 5 30 sec delay 150 MW 150 MW 37.5 MWH 36.25 MWH 0 MWH 1.25 MWH 37.5 MWH 0 MW 16:00:00 16:15:00 16:30:00 16:45:00 $1000/ MWH $35/ MWH $35/ MWH Presentation MIT
Price/Demand Responsive LoadExcel Worksheet for Calculation Fill in the following values: 1. Load (MWH) 2. Time deviation (sec) 3. Price ($/MWH )in each interval Presentation MIT
Price/Demand Responsive LoadIDR slower than NIST clock by 30 sec, 150 MW load Presentation MIT
Price/Demand Responsive LoadEffect of Time Delay at Different Load Levels Price in Interval 2: $35/MWH Price in Interval 4: $1000/MWH Note: Net losses calculated over entire 5 interval event Presentation MIT
Price/Demand Responsive LoadEffect of Time Delay at Different Price Levels Price in Interval 4: $200/MWH Price in Interval 4: $500/MWH Note: Net losses calculated over entire 5 interval event Price in Interval 4: $1000/MWH Price in Interval 4: $3000/MWH Presentation MIT
Price/Demand Responsive LoadIDR faster than NIST clock by 30 sec, 150 MW load -Accelerated IDR Clock -NIST Clock Interval 1 Interval 2 Interval 3 Interval 4 Interval 5 Losses and savings intervals interchanged Values remain same 30 sec delay 150 MW 150 MW 0 MWH 36.25 MWH 1.25 MWH 37.5 MWH 37.5 MWH 0 MW 16:00:00 16:15:00 16:30:00 16:45:00 $1000/ MWH $35/ MWH $35/ MWH Presentation MIT
Aggregate IDR Load IDR slower than NIST clock by 30 sec -Delayed IDR Clock -NIST Clock Interval 1 Interval 2 Interval 3 10,400 MWH 30 sec delay 10,200 MWH 10,000 MWH Energy Recorded by IDR In Interval 2 = Energy Consumed in Interval 2 + Metered Energy Shifted from Interval 3 to 2 - Metered Energy Shifted from Interval 2 to 1 10,206.67 MWH = 10,200.00 MWH + 346.67 MWH – 340.00 MWH Note: IDR accounts for 70% of total grid load Presentation MIT
Aggregate IDR Load IDR faster than NIST clock by 30 sec - Accelerated IDR Clock -NIST Clock Interval 1 Interval 2 Interval 3 10,400 MWH 30 sec delay 10,200 MWH 10,000 MWH Energy Recorded by IDR In Interval 2 = Energy Consumed in Interval 2 + Metered Energy Shifted from Interval 1 to 2 - Metered Energy Shifted from Interval 2 to 3 10,193.33 MWH = 10,200.00 MWH + 333.33 MWH – 340.00 MWH Note: IDR accounts for 70% of total grid load Presentation MIT
Aggregate IDR Load Example: June 09, 2011IDR slower than NIST clock by 30 sec Average UFE: 0.4000% Average Shift in Interval Load Due to IDR Delay: 0.0006% Presentation MIT
Aggregate IDR Load Example: April 21, 2011 IDR slower than NIST clock by 30 sec Average UFE: 0.3606% Average Shift in Interval Load Due to IDR Delay: 0.0014% Presentation MIT
Aggregate IDR Load Example: Dec 21, 2010IDR slower than NIST clock by 30 sec Average UFE: -1.2298% Average Shift in Interval Load Due to IDR Delay: 0.0004% Presentation MIT
Aggregate IDR Load Example: Jul 8, 2011IDR slower than NIST clock by 30 sec Average UFE: 1.0757% Average Shift in Interval Load Due to IDR Delay: 0.0014% Presentation MIT
Aggregate IDR Load Example: Feb 2, 2011IDR slower than NIST clock by 30 sec Average UFE: 1.9799% Average Shift in Interval Load Due to IDR Delay: 0.0007% Presentation MIT
Summary • Observations of this study are as follows: • Flat load • No Impact • Price/demand responsive load • Potential impact. Will depend on site operating procedures and load characteristics • IDR clock error combined with variations in price of electricity will result in savings in one interval, with losses in other • Aggregate IDR load • Meter clock error up to 45 seconds has minimal impact on aggregate IDR load used in wholesale settlements • IDR clock error combined with variations in price of electricity will result in savings in one interval, with losses in other • Note: Study of impact of elimination of time error correction on retail settlements or an individual market participant has not been performed. Each individual party should carry out their own study based on their specific load characteristics Presentation MIT
Questions? Presentation RMS