Download
1 / 32
320 likes | 349 Vues
This presentation delves into the complexities of measuring digital information use at the University of Pennsylvania Library. It explores the environmental influences affecting assessment processes, technology's impact on measurement, and strategies for leveraging data to enhance organizational effectiveness. The discussion covers the growth of electronic resources, the challenges of obtaining accurate data, and the importance of aligning measurement practices with organizational goals. Overall, it provides insights into the evolving landscape of library information technology and its impact on user engagement.

E N D
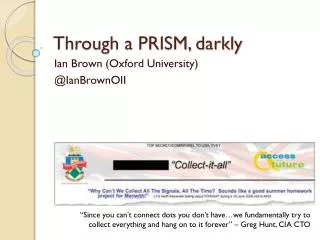
Through the Bytes Darkly, Management Information and the Digital Library Information Technology Interest Group ACRL, New England Chapter May 17, 2002 Joe Zucca Assessment, Planning and Publications Librarian University of Pennsylvania Library
Four Sections of This Presentation: 1. Environmental Audit: Key Factors That Influence Our Ability to Measure Digital Information Use 2. From Low Resolution to High Resolution Data: Mining the Server Logs 3. The Data Farm Experiment: Tools That Serve Access Can Also Serve Measurement 4. Why the Data Are Important
Measuring Electronic Use at Penn: Environmental Influences 1. Organization and Culture Strategic Focus Base planning, goal setting/assessment on empirical evidence. From 1996- an element of Penn’s Strategic Plan Operational Imperatives 1) Make evaluation and measurement a component of each program and project 2) Construct relays that feed data to people who need quantitative information to strategize and manage Experimental Attitude Leverage the data you have; usually they’re “good enough” to validate organizational experience and knowledge
Measuring Electronic Use at Penn: Environmental Influences 2. Proliferation of Electronic Resources Article indexes, e-journals and other full-text resources
1000% 900% 800% 700% 600% 500% PCT Increase in Expenditure 400% 300% 200% 100% 0% 1991 1993 1996 1999 2000 2001 Measuring Electronic Use at Penn: Environmental Influences 2.1. Growth of Expenditures for Electronic Resources Annual Growth of Expenditures for Electronic Information Based on 1991 E-Resources as a percent of acquisitions budget • 1991 1993 1996 1999 2000 2001 • 3.7% 3.2% 5.5% 13.2% 13.9% 15.7%
Measuring Electronic Use at Penn: Environmental Influences 3. Technology’s Hostility to Measurement • Volatile metrics (“The new system doesn’t count that way!”) • Ever-changing data elements (“sets are out “searches” are in) • No common metrics (log-ins, sessions, searches, browses, page hits…) • No measurement standards (What’s a “search”?, What’s a Web “session”?) • Non existent or inaccessible data (the vendor problem) • Approximate & hard to obtain statistics (lots of data, no information) • Fleeting benchmarks
From Low Resolution to High Resolution Data: Mining the Server Logs for Descriptive Statistics dial-123-130.dial. indiana.edu - - [04/ Feb/2001 :00:18:02 -0500] "GET /special/ photos/ theater/504.html HTTP/1.0" 200 3247 "http://www.library.upenn. edu /special/photos/ theater /503.html" "Mozilla/4.7 C-CCK MCD {C-UDP; EBM-APPLE} (Macintosh; I; PPC)” dialin1085. upenn.edu--[04/Feb/ 2001:00:18: 04 -0500]"GET/facilities/count_ use.html?resource =China%20Economic%20 Review& method= ejs& url= http://www.sciencedirect.com/ science/journal/ 1043951XHT TP/1.0" 200 2027 "http:// www.library.upenn.edu/webbin 5/ resources/ejspubl ic5.cgi?homepage=http:// www. library.upenn.edu/lipp incott/&community= Business" "Mozilla/ 4.0 (compatible; MSIE 5.0; Windows 98; DigExt; SPIKE 5)” 203.197. 226.240 - - [04/Feb/2001:00:18:07 -0500] "GET /etext/sasia/aiis/ architecture/khajuraho/ 010a.jpg HTTP/1.0" 200 89117 "http://www.library.upenn.edu/etext/sasia/ aiis/arch itecture/khajuraho/010.html" "Mozilla/4.7 [en] (Win95; I)”
Low Resolution Inputs Records in locally-managed databases (including the OPAC)………………………26,332,138 Number of journal article indexes & full-text files (e.g. Academic Index)…….……………...267 Number of e-journals (from publishers such as Elsevier and free sources)…..…………..6,608 Number of digital books (locally created, aggregated and licensed)…….……………...110,000 Number of locally digitized and accessible images (e.g. fine art slides, ms facsimiles)..82,356 Number of records in the OPAC ……………………………….....……………………...2,879,696 Number of pages, forms and directories constituting the library web site……………….32,000
2,000,000 1,800,000 Total pages requested: FY 96 2,481,146 FY 97 5,316,283 one-year increase................114.3% 1,600,000 FY 98 7,038,872 ...................32.4% FY 99 11,807,289 ...................67.7% FY00 12,540,531 .....................6.2% 1,400,000 FY01 14,461,712 ....................15.3% 1,200,000 1,000,000 Web Pages Requested per Month 800,000 600,000 400,000 200,000 0 Jul-00 Jul-95 Jul-96 Jul-97 Jul-98 Jul-99 Jan-00 Jan-01 Jan-96 Jan-97 Jan-98 Jan-99 Oct-99 Oct-00 Oct-95 Oct-96 Oct-97 Oct-98 Apr-00 Apr-01 Apr-96 Apr-97 Apr-98 Apr-99 Low Resolution The Load on Our Machines Web Pages Served 1995-2001 from www.library.upenn.edu. 3-month moving average
Low Resolution Changing Machine Demand BlackBoard Pages Served by the Main Library Web Server + OPAC Server 25,000,000 OPAC Web 20,000,000 15,000,000 10,000,000 5,000,000 0 2002 1996 1997 1998 1999 2000 2001 Projected
Low Resolution Search Activity Over Time Annual Searches in Licensed Databases (e.g., MEDLINE), FY97-01 searches
Correlation Matrix of Use Metrics Available forOvidFiles Pearson r for Sessions, Connect Time, Sets, Documents Viewed 99 cases Sessions Time Sets Docs.Viewed Sessions 1.00 Time .980 1.00 Sets .905 .971 1.00 Documents Viewed .844 .932 .983 1.00
Correlation Matrix of Use Metrics Available for SilverPlatter Files Pearson r for Sessions, Connect Time, Searches, Documents Viewed Sessions Time Searches Abs. Viewed Sessions 1.00 Time .975 1.00 Searches .899 .901 1.00 Abstracts Viewed .840 .870 .855 1.00 94 cases
High Resolution Data + User Input + Good Program Liaison and Knowledge Support Resource Management, and Inform Basic Questions, e.g.: • Are we choosing the right information sources for our audiences? • …optimizing the delivery of electronic information? • …making access as easy and seamless as possible? • …spending our dollars wisely? • …able to detect and respond to change in the patterns of resource use?
Using the Architecture of the Web to Increase Data Resolution www.library.upenn.edu/facilities/count_use.html
Beginning with a stream of unprocessed log data... dial-123-130.dial. indiana.edu - - [04/Feb/2001:00:17:38-0500] "GET/special/photos /theater/505.html HTTP/1.0" 200 3086 "http://www.library. upenn.edu/special/photos/theater/504.html" "Mozilla/4.7C-CCK-MCD {C-UDP; EBM-APPLE} (Macintosh; I; PPC)” recrawler 1.bos2.fastsearch.net - -[04/Feb/2001:00: 18:21- 0500] "GET /etext/ sasia/skt-mss/1549 /15a.html HTTP/1.0" 200 2736 "-" "FAST -WebCrawler/2.2-pre27 (crawler@ fast.no; http://www .fast.no/faq/ faqfastweb search/faqfastwebcrawler.html)"130.91.196.245.in-addr.arpa--[04/Feb/2001:00 :17:40 -0500] "GET /facilities/count_use.html?resource =ABI/Inform %20 %20Ovid &method= Ovid&url=http:// www.abi-ovid.library.upenn.edu/ovid web/ovidweb.cgi? T=JS& PAGE =main&MODE=ovid& D=infoz HTTP/1.1" 200 2039 "http://www.library.upenn.edu/webbin5/resources/ databases.cgi? business" "Mozilla/4.0 (compatible; MSIE 5.5; Windows NT 4.0)”203.197.226.240 - - [04/Feb/2001:00:17:41 -0500] "GET /etext/sasia/aiis/architecture /khajuraho/010.html HTTP/1.0" 200 4427 "http://www. library.upenn.edu/etext/ sasia/ aiis/architecture/ khajur aho/" "Mozilla/4.7 [en] (Win95; I)” 203.197.226. 240- -[04/Feb/200 1:00:17:44 -0500] "GET /images/banner. gifHTTP/1.0" 404 2814 "http://www.library. upenn. edu/etext/sasi a/aiis/architecture /khajuraho/010.html" "Mozilla /4.7 [en] (Win95; I)"pub237.lib.upenn.edu - - [04/Feb/ 2001:00:17:48 -0500] "GET / HTTP/1.0" 200 8070 "-" "WebTrends Alert” dial-123-130.dial. indiana.edu - - [04/ Feb/2001 :00:18:02 -0500] "GET /special/ photos/ theater/504.html HTTP/1.0" 200 3247 "http://www.library.upenn. edu /special/photos/ theater /503.html" "Mozilla/4.7 C-CCK MCD {C-UDP; EBM-APPLE} (Macintosh; I; PPC)” dialin1085. upenn.edu--[04/Feb/ 2001:00:18: 04 -0500]"GET/facilities/count_use.html?resource=China%20Economic%20 Review& method= ejs& url= http://www.sciencedirect.com/ science/journal/ 1043951XHT TP/1.0" 200 2027 "http:// www.library.upenn.edu/webbin 5/ resources/ejspubl ic5.cgi?homepage=http:// www. library.upenn.edu/lipp incott/&community= Business" "Mozilla/ 4.0 (compatible; MSIE 5.0; Windows 98; DigExt; SPIKE 5)” 203.197. 226.240 - - [04/Feb/2001:00:18:07 -0500] "GET /etext/sasia/aiis/ architecture/khajuraho/ 010a.jpg HTTP/1.0" 200 89117 "http://www.library.upenn.edu/etext/sasia/ aiis/arch itecture/khajuraho/010.html" "Mozilla/4.7 [en] (Win95; I)”
…and information culled from databases that generate our Web pages... Æ |http://www.uqtr.uquebec.ca/AE/index.html|World||||History of Art|F-T|No|07-16-1999 : 11:11|10-25-2000 : 11:30|| ABA Bank Compliance |http://proquest.umi.com/pqdlink?Ver=1&Exp=07-01-2003&REQ=3&PUB=14954&Cert=0CEccdp7 aMS6kuCDmdhPNL%2bQ2tTOLTrDEHAz%2bYmHN172RUqZPCJ2SvATX%2bFGA7htIYkVlFVWSyawE0NvKlpBZ%2bO%2f%2bLEWBnchnwLT9%2b%2fdGGHSlx0PO3dxUQd3g2S9QP2FghKaQ2ncl5EdDKBum2vykhvxsyRQutjuMGKfxAKHOA4-|Penn|ABI/Inform|||Business,Finance|F-TPI| No|03-13-2001: 00:01|03-14-2001 : 11:31|mw| ABA Journal |http://proquest.umi.com/pqdlink?Ver=1&Exp=07-012003&REQ=3&PUB=27585&Cert=PfySiFXf1 0i6kuCDmdhPNL%2bQ2tTOLTrDEHAz%2bYmHN172RUqZPCJ2SvATX%2bFGA7ht1pGvDP%2bFxrGwE0NvKlpBZ%2bO%2f%2bLEWBnchnwLT9%2b%2fdGGHSlx0PO3dxUQd3g2S9QP2FghKaQ2ncl5EdDKBum2vykhvxsyRQutjuAyIsegc4Y7Y-|Penn|ABI/Inform|||Finance|F-TPI|No|03-13-2001: 00:01||mw| ABI/Inform |http://www.umi.com/pqdauto|Penn||||Biomedical Research,Management,Business,Clinical Medicine,Clinical Medicine,Nursing, Econo mics, Health Care Policy & Management| F-TSDb|No|07-16-1999 :11:11|02-09-2001 12:14||
…to extracting, parsing, storing, and mining for significant content.
Use of Licensed Resources What Databases Do Our Clients Use at What Cost? 15 Most Frequently Used Index/Abstract/Full-text Databases in FY 2001 Database Log-ins Pct Total Cost Per Login
Use of Licensed Resources What Are the High Use E-Journals, Data for FY2001 Title Log-ins Pct Total Log-ins Log-ins On Campus Off Campus
Use of Licensed Resources How Much Bang Do We Get on the Dollar For E-Journals? E-Journal Subscription Costs Per Log-In, FY2002 (July-April) Publisher Log-ins Pct of Total Cost Per Login ScienceDirect 139,727 27.1% $0.63 ECO 70,730 13.7% $0.09 JSTOR 48,668 9.4% $0.35 Wiley 38,255 7.4% $0.09 ACS 31,865 6.2% $0.12 Ideal 30,568 5.9% $5.51 Blackwell/Munksgaard 28,940 5.6% $0.27 Journals@Ovid 26,982 5.2% n/a Oxford 14,819 2.9% $0.20 SpringerLINK 13,507 2.6% n/a ABI/Inform 12,785 2.5% $3.08 Project Muse 11,438 2.2% $1.22 AIP 7,873 1.5% $5.01 Cambridge 7,835 1.5% n/a Annual Reviews 7,215 1.4% $0.08 IEEE 7,132 1.4% $6.73 RSC 5,661 1.1% n/a Others† 11,451 2.2% Total 515,451 100% † 11 publishers
100% 90% 80% 70% 60% PCT of Use 50% 40% 30% 20% 10% 0% 0% 10% 20% 30% 40% 50% 60% 70% 80% 90% 100% PCT of Titles Use of Licensed Resources How Does Use Scatter Across Databases Use Measured in Log-ins for FY 2001
Medicine 23.2% Arts & Sci 20.4% In-Library 12.8% Wharton 12.3% Admin 4.8% Enginrng 4.4% Nursing 3.5% Veterinary 2.5% Education 1.4% Social Wrk 1.8% Commnctn 1.3% Fine Arts 1.0% Dental 0.9% Law 0.5% Dorms 9.3% Database Use by Penn’s Schools & Centers Use of Licensed Resources School Pct of Log-ins How Does Database Use Distribute By Communities? Per Capita Use of Databases by Penn’s Schools and Centers, FY 2001 55 50 45 40 35 30 Log-insPer Capita 25 20 15 10 5 0 LAW† VET SAS ASC GSE NUR MED SSW SEAS GSFA WHRT ADM DENTAL School and Center Domains †Does not include resources licensed by the Law Library for Law school affiliates
Use of Licensed Resources Database & E-Journal Log-ins by Subject (based on log samples from FY2001) Subject focus Human. Life Social Business Physical Total Science Science Science Administration 21.1% 36.5% 13.9% 07.0% 21.6% 100.0% Wharton 02.9% 74.3% 03.2% 19.2% 00.5% 100.0% Annenberg 15.2% 32.1% 42.3% 08.9% 01.5% 100.0% Medical 02.3% 86.0% 01.9% 01.0% 08.8% 100.0% Dental 01.8% 87.7% 08.9% 00.2% 01.4% 100.0% Veterinary 01.7% 96.0% 00.6% 00.4% 01.3% 100.0% Dialin 08.5% 63.2% 09.9% 15.4% 02.9% 100.0% Education 24.6% 13.1% 61.5% 00.8% 00.0% 100.0% Fine Arts 29.0% 18.5% 45.7% 5.6% 01.2% 100.0% Law 13.0% 26.6% 20.9% 37.0% 02.4% 100.0% Library 21.3% 54.8% 09.1% 08.5% 06.3% 100.0% Nursing 15.9% 73.1% 07.8% 03.2% 00.0% 100.0% Student Residences 18.9% 57.0% 12.6% 09.0% 02.5% 100.0% Arts and Sciences 08.2% 26.3% 5.7% 09.9% 49.9% 100.0% Engineering 0 1.5% 29.5% 2.3% 01.2% 65.6% 100.0% Social Work 20.6% 29.1% 41.6% 06.1% 02.7% 100.0% Unresolved 18.9% 44.7% 17.8% 10.0% 08.6% 100.0% Total 14.7% 50.7% 11.9% 8.6% 14.1% 100.0% Network Domain
Use of Licensed Resources Where Do Our Clients Access Information? Database Log-ins by Domain, FY2001 Campus Residences 10% Off-Campus 15% In-Library 25% On-Campus Depts 50%
100.0% 90.0% 80.0% 70.0% 60.0% 50.0% 40.0% 30.0% 20.0% 10.0% 0.0% VET GSE SAS ASC MED LAW SSW SEAS GSFA NURS ADM† WHRT DENTL On Campus Off-Campus Use of Licensed Resources Where Do Communities of Clients Work? Database Log-ins from Off Campus as a Percent of Total Log-ins, FY2001 Pct. of Log-ins School or Center
25000 In-Library Student Houses Schools Campus Modem Pool 20000 15000 Attempted Logons 10000 5000 0 1-2 AM 2-3 AM 3-4 AM 4-5 AM 5-6 AM 6-7 AM 7-8 AM 8-9 AM 6-7 PM 7-8 PM 8-9 PM 5-6 PM 1-2 PM 2-3 PM 3-4 PM 4-5 PM 12-1AM 9-10 AM 9-10 PM 12-1 PM 10-11 AM 11-12 AM 10-11 PM 11-12 PM Use of Licensed Resources When Are They Working? Database Use by Time of Day, FY2001
Use of Licensed Resources How Does Audience Composition Change Through the Day? Database Use by hour, FY2001
The Data Farm Experiment: Tools That Serve Information Access Can Also Serve Measurement
Schematic of the Data Farm As of May 2002
Why Are the Data Important? “If you don’t know where you’re going, you’ll probably end up somewhere else” - Casey Stengel To Demonstrate Accountability: Is the library spending the Schools’ money effectively? (Pressures of Penn’s responsibility center budget environment) To Understand and Describe the Transfer of Technology: Is the academic information universe a digital universe (as some at Penn believe)? Is the digital universe more cost efficient than the paper one (as some at Penn believe)? To Guide the Improvement of Existing and the Development of New Services To Ensure the Successful Fulfillment of Our Mission
Through the Bytes Darkly, Management Information and the Digital Library Joe Zucca University of Pennsylvania Library zucca@pobox.upenn.edu