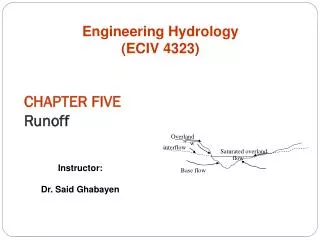
Runoff
Runoff. Hydrographs and the SCS Curve Number Method. Runoff vs. Streamflow. Runoff is the result of a precipitation event. Streamflow is baseflow + runoff that makes it to the stream channel. What is a watershed?.


Runoff
E N D
Presentation Transcript
Runoff Hydrographs and the SCS Curve Number Method
Runoff vs. Streamflow Runoff is the result of a precipitation event Streamflow is baseflow + runoff that makes it to the stream channel.
What is a watershed? • A watershed is entire drainage area of a stream or river, from which the surface and groundwater leave at a single point. • Usually defined by elevation. • Large rivers with several tributaries are typically called river basins • Watershed is used for tributaries / small streams
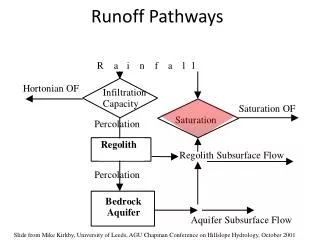
Watershed Factors that Affect Surface Runoff • Topography • Surface runoff occurs in the direction of land slope • Perpendicular to the contour lines • Land slope has a significant effect on water velocity • Overland flow • Channel flow
Elevation Contours with Surface Runoff 280’ 270’ 300’ 290’ Surface Runoff (perpendicular to contour lines)
Watershed Factors that Affect Surface Runoff • Watershed shape • Circular watersheds have higher rates of runoff • Runoff from different points reach outlet at same time • Elongated watersheds have lower rates than circular • Downstream tributaries reach outlet first • Soil • Controls the infiltration process
Watershed Factors that Affect Surface Runoff • Land use • Vegetative cover reduces runoff • Improves soil structure • Depletes soil moisture creating a dry antecedent moisture • Bare soil results in increased runoff • Poor structure • Less permeable and can have surface sealing • Fine soil particles washed into larger soil pores
Streamflow Components • Baseflow: Continuous flow supported by seepage and groundwater flow. • Runoff-AKA Storm water runoff. Excess rainfall from storm events. • What is a runoff hydrograph? • Continuous record of streamflow over time.
Runoff Hydrographs • Complete Runoff Hydrograph Contains: • Runoff Volume-Area under the hydrograph • Peak Flow Rates-maximum flow or peak of the runoff hydrograph. • A complete time history of the flow. • For small watersheds we ignore baseflow so that: Runoff=effective rainfall=precipitation - abstractions
Conceptual Model t3 t4 Dt t2 t5 t1 a5 area a3 a1 a2 a3 a4 a5 a4 t1 time a1 a2 Rainfall with uniform intensity of r1 and duration of Dt falling uniformly on the watershed.
Conceptual Model for Runoff • Conceptual model is very steeply rising and falling with a base time only slightly longer than the duration of the rainfall excess. • An actual hydrograph would have a lower peak and slower recession, due to tremendous capacity for storage.
Stream Hydrograph Discharge (Q) Peak discharge Recession limb Rising limb Base flow Base flow Time (T)
Storm Hydrograph (Surface runoff only / base flow removed) Discharge (Q) Peak discharge Qp Recession limb Rising limb Tbase Time (T)
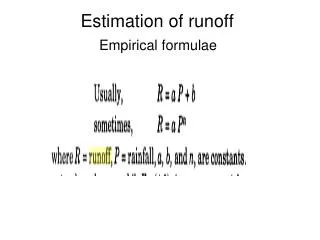
Runoff • Typically determined in one of two ways: • Mass balance approach • Effective rainfall
Mass Balance Approach • Continuity Equation • Inputs – Outputs = Change in Storage • Input is typically precipitation. • Outputs can be infiltration, ET, etc. depending on scale. • Storage can be interception, soil water storage, etc. again depending on the scale and scope.
Effective Rainfall The SCS Curve Number Approach
Effective Rainfall • Rainfall that becomes runoff. • Effective Rainfall = Precipitation – Initial Abstractions • Also called Rainfall Excess. • Effective Rainfall=Rainfall Excess=Runoff
SCS Curve Number Approach • By far the most popular method. • Combines initial abstractions and infiltration losses and estimates rainfall excess as:
Curve Number • A parameter that combines soil type and land use to estimate runoff potential. • Based on the Hydrologic Soil Group (HSG), land use and condition. • Range between 0 and 100. The greater the curve number, the greater the potential for RO. • Impervious areas and water surfaces are assigned curve numbers of 98-100.
Hydrologic Soil Groups and Land Use • SCS classified more than 4000 soils into four general HSG (A, B, C, and D) • Based on soils minimum infiltration rate when the soil is bare and after prolonged wetting. • In general A have the highest infiltration capacity and lowest runoff potential (sandy soils) and D have lowest infiltration rates and highest runoff potential (clay soils) • Curve numbers for various land uses ranging from cultivated land to industrial and residential districts.
Antecedent Moisture Conditions • Curve numbers in tables are for CN(II) or normal antecedent soil moisture conditions. • If conditions are dryer than normal than a CN(I) should be used. • If conditions are wetter than normal than a CN(III) should be used. • Table 5.2 gives adjustment factors for CN(II) to obtain CN(I) or CN(III).
Mixed Land Uses and HSG’s • An area weighted CN is used when the area considered is for mixed land uses and HSG’s.
Example Problem • Given: • Precipitation (P) = 4.04 in. • A watershed that has: • 35% cultivated with a D soil group • 30% meadow with a B soil group • 35% thin forest with a C soil group • Required: • Calculate the surface runoff (excess rainfall)
Watershed with Land Use % and HSGs Listed 30% Meadow HSG = B 35% Cultivated HSG = D 35% Thin Forest HSG = C
Example Problem • Find the curve numbers Use HSG % CN* Cultivated D 35 91 Meadow B 30 58 Thin Forest C 35 77 *Table 5.1 text (reference is important) • Calculate a weighted CN Weights based on % area CNavg = 0.35(91) + 0.30(58) + 0.35(77) CN avg = 76.2 = 76
Example Problem • Calculate the S term S = 1000 / CN – 10 = (1000 / 76) – 10 S = 3.16 in. • Check to see if P > 0.2S 0.2S = 0.2(3.16) = 0.63 in. P > 0.2S • Calculate surface runoff (Q) Q = [(P - 0.2S)^2] / (P + 0.8S) Q = [(4.04 – 0.2(3.16)]2 / [4.04 + ((0.8)3.16)] Q = 1.77 in. For a rainfall event = 4.04 in. on the given watershed with average soil moisture conditions
AGSM 335 • Homework 4
Creating an Effective Rainfall Hyetograph • Calculate the accumulated P for each time step from a rainfall hyetograph. • Calculate the appropriate weighted CN. • Calculate S using Equation (5.3). • Find 0.2S. • For each time step where the accumulated P > 0.2 S calculate the accumulated Q using Equation (5.4). • Find the incremental Q at each time step. • Plot the incremental Q vs. time.