Runoff Hydrographs
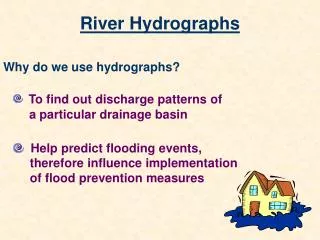
Runoff Hydrographs. The Unit Hydrograph Approach. Storm Water Hydrographs. Graphically represent runoff rates vs. time Peak runoff rates Volume of runoff Measured hydrographs are best But not often available Methods are available to develop a “synthetic” hydrograph

Runoff Hydrographs
E N D
Presentation Transcript
Runoff Hydrographs The Unit Hydrograph Approach
Storm Water Hydrographs • Graphically represent runoff rates vs. time • Peak runoff rates • Volume of runoff • Measured hydrographs are best • But not often available • Methods are available to develop a “synthetic” hydrograph • Use a unit hydrograph (UHG)
Development of RO Hydrographs • Most often interested in hydrographs at the watershed outlet (and possibly some selected points in the watershed). • We modify the rainfall hyetograph to reflect watershed characteristics. • The volume under the effective rainfall hyetograph is equal to the volume of surface runoff.
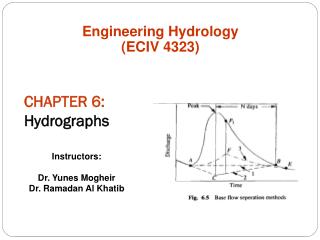
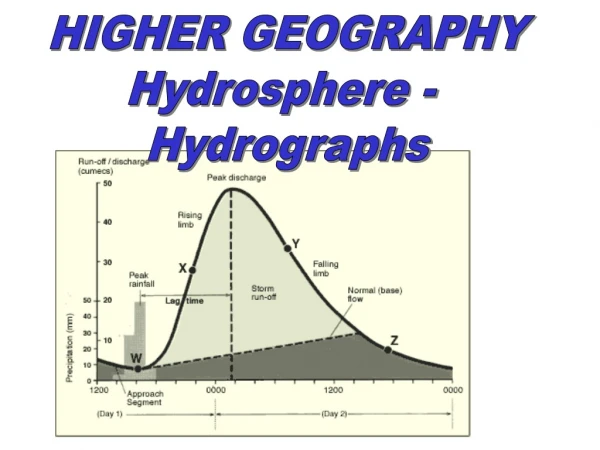
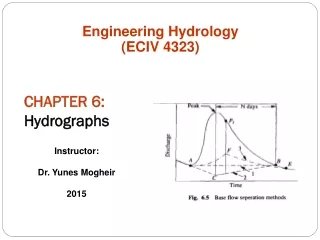
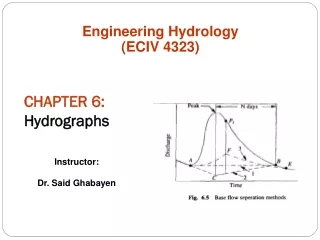
Hydrograph components • qp is the maximum flow rate on the hydrograph • tp (time to peak) is the time from the start of they hydrograph to qp. • tb (base time) is the total time duration of the hydrograph.
Hydrograph Components • tc (time of concentration) time it takes water to flow from the hydraulically most remote point in a watershed to the watershed outlet • tL (lag time) is the average of the flow times from all locations in the watershed and can be estimated as the length of time from the center of mass of the first effective rainfall block, to the peak of the runoff hydrograph. • If each block of effective rainfall has a duration of D
Unit Hydrograph • Hydrograph of runoff resulting from a unit of rainfall excess occurring at a uniform rate, uniformly distributed over a watershed in a specified duration of time.
Unit Hydrographs • Assumptions: • Rainfall intensity is not considered • Linear relationship between stormwater runoff and rainfall • UHG is independent of antecedent conditions • Uniform rainfall distribution
Duration of the Unit Hydrograph • Each unit hydrograph has a duration that is the same as the duration of the rainfall excess that produced it. • Conceptually can have an infinite # of hydrographs corresponding to different durations. • Practically, a unit hydrograph is applied to rainfall excesses of duration as much as 25% different than the duration of the unit hydrograph.
How is the unit hydrograph used? • For a unit hydrograph of duration, D, the volume underneath the hydrograph is always 1, produced by 1 unit of excess rainfall. • A hydrograph for a block of rainfall excess of any depth is obtained by multiplying the ordinates of the unit hydrograph by the depth of the rainfall excess block. • The result is the ordinates of the runoff hydrograph.
How is the unit hydrograph used? • Rainfall excess is divided into blocks, each of a uniform duration, D. • A component hydrograph for each block of rainfall is calculated. • The starting time for each hydrograph coincides to the starting time of the appropriate block of rainfall excess. • All the component hydrographs are added vertically to obtain the total runoff hydrograph for the storm.
Checking the volume under a unit hydrograph. • Where: • Dt is the duration time increment of the hydrograph (min) • Sqi is the sum of the ordinates of the runoff hydrograph (cfs) • A is the area (acres)
Deriving unit hydrographs • Unit hydrographs can be derived from records of observed rainfall and streamflow BUT • For small watersheds, synthetic unit hydrographs are generally used. • Synthetic unit hydrographs provide ordinates of the unit hydrograph as a function of tp, qp and a mathematical or empirical shape description.
Estimating the time parameters • Time of concentration (tc) • For some areas, we can sum the time for various flow segments as the water flows toward the watershed outlet. • Segments • Overland flow • Shallow channel flow • Flow in open channels.
Lag time, tL SCS Equation to calculate time lag L = hydraulic length of watershed (feet) S = curve number parameter (inches) Y = average land slope of the watershed (%) tl = time lag (hours)
Time to Peak and Duration • Duration of rainfall excess should be 1/5 to 1/3 tp. • Base time, tb • tb=2.67 tp. • Some use tb = 5tp • Some use tb = ∞
Estimation of peak flow parameters • General form • For a triangular unit hydrograph with tb=2.67 tp • Where: • tp is the time to peak (hrs) • qp is peak flow (cfs) • A is watershed area (square miles)
Shapes of unit hydrographs • SCS uses a dimensionless unit hydrograph (Figure 3.34). • Also have a triangular unit hydrograph derived to have the same tp and qp as the dimensionless hydrograph. • If either of these are used the qp and tp are related through
Triangular hydrographs • Good approximation for peak and duration. • Find the qp and tp of the unit hydrograph. • Multiply qp by the depth of the rainfall excess block. • Use the tb approximation to find the duration of the hydrograph.
Example 5.10 in Text (modified) Solution: • HSG = D / Commercial T. 5.1 CN = 95 • S = 0.53 in. • Assume AMC = II Q = 1.96 in. of runoff • Find points to develop the unit hydrograph • tl = 0.75 hr (45 min) • tp = 1.25 hr (75 min) • tb = 3.33 hr (200 min) • qp = 302 cfs / 1 in. of runoff • Plot unit hydrograph • Check area under the triangle 1 in.
600 400 qp = 302.5 cfs 300 Q (cfs) 200 tp = 75 50 100 150 tb = 200 T(min)
Volume under triangle = (302.5 cfs x 4,500 sec) / 2 + [(302.5 x (12,000 – 4,500 sec)] / 2 = 1,812,000 ft3 Surface runoff depth = 1,812,000 ft3 / 21,780,000 ft2 = 0.08 ft = 1.0 in. ok
Example 5.10 in Text Solution: qp 2.5” rain = 302.5 cfs x 1.96 in. of SRO qp 2.5” rain = 592.9 cfs Plot storm hydrograph Check area under the triangle 1.96 in.
Q (cfs) qp = 592.9 cfs 600 Surface runoff depth = 1.96 in. ok 400 Volume under triangle = 3,557,400 ft3 300 200 tp = 75 50 100 150 tb = 200 T(min)
AGSM 335 • Homework #6
Haan equation SCS dimensionless unit hydrograph • Where: • qp is peak flow (in/hr) • To convert from cfs to in/hr divide by A (acres) and 1.008. • tp is time to peak (hrs) • V is volume under the hydrograph (V=1 for unit hydrograph) • For a unit hydrograph K should be close to 3.77
Example 5.11 in text Using SCS UHG • Rainfall excess for each time block of duration 15 minutes 0.17, 1.10, 0.84 • tp =52.5 minutes qp = 432 cfs • Convert qp to in/hr. • Calculate K
Coordinates of the UHG • For each time block of duration D, calculate q(t) using: • These are the ordinates of the UHG. • For each excess rainfall block multiply the depth of the excess rainfall by all the ordinates of the unit hydrograph. • Each hydrograph should begin at the time the rainfall excess block begins. i.e. If the rainfall excess block occurred at 30 minutes, the hydrograph should start at 30 minutes.
Creating the Total Runoff Hydrograph • Add the contents of each row (not including the UH ordinates) to get the total runoff at each time t. • Plot t vs. Q.
BAEN 460 • Homework #6