FLOOD HYDROGRAPHS
FLOOD HYDROGRAPHS. FOR GCSE GEOGRAPHY. What is a Flood/Storm Hydrograph?. A storm hydrograph records the intensity of the flood during the course of the storm.


FLOOD HYDROGRAPHS
E N D
Presentation Transcript
FLOOD HYDROGRAPHS FOR GCSE GEOGRAPHY
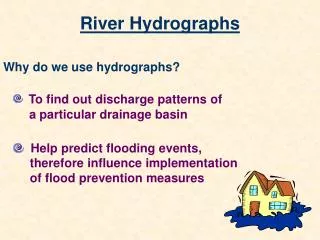
What is a Flood/Storm Hydrograph? • A storm hydrograph records the intensity of the flood during the course of the storm. • Storm hydrographs are useful to assess how much water has been added to the base flow (the normal flow of the river). Base flow is often drawn as a line on the graph.
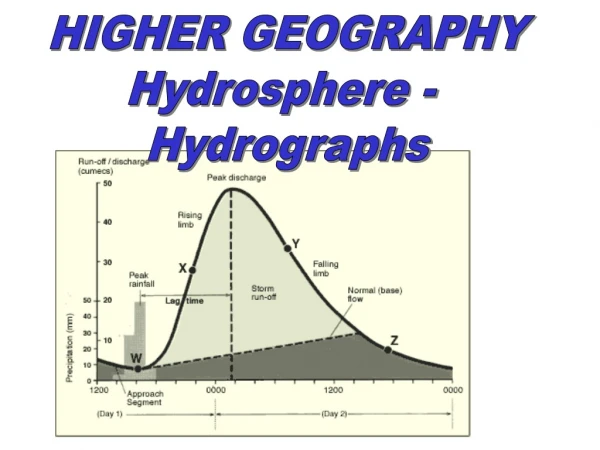
A flood hydrograph is a line graph plotting discharge of a river over time. It therefore shows a trend in the river. • Often rainfall is plotted on the same graph as a bar chart. • The flood hydrograph has a particular structure and terminology to go with that structure which is explained in the next few slides. using the following diagram.
It shows the rainfall amount and then the discharge of the river. The water then will make its way into the river and you can use a hydrograph to see how quickly this occurs. By looking at the peak rainfall and comparing it with the peak discharge you can work out the lag-time (the time between the two peaks). What does a flood hydrograph show me? Most of the rain falls onto the land rather than directly into the river.
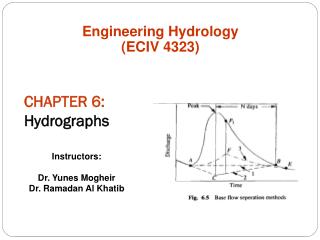
The Flood Hydrograph. B - TIME LAG (or LAG TIME). The time between the peak discharge and highest point in a river. This is the time it takes for precipitation to run-off from where it has fallen to the river channel. Many factors can affect this, such as permeability of rocks and interception from vegetation. C - PEAK DISCHARGE. This is the very highest point to which the river discharge reaches. A - DISCHARGE (in cumecs). This axis measures the amount of water passing through the river in cubic metres per second D - ZONE OF FLOOD RISK. The area above the dotted line within the loop of the graph is the time at which the river is likely to flood. E - ZONE OF NORMAL DISCHARGE. The dotted line represents the normal discharge of the river when there is no rain. This zone is when the river is not a position to flood. F - RECESSION LIMB. The discharge at this point is falling. G - RISING LIMB. The discharge at this point is rising.
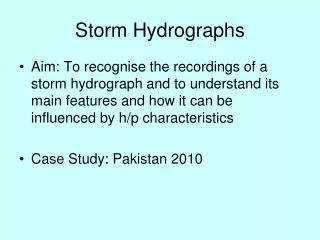
Why does flooding occur in the Drainage Basin system? Flooding occurs due to a sudden increase in the amount of water traveling down a river, and can occur for a number of reasons: • - A rapid snow melt • - A prolonged period of heavy rain • - A sudden and intense fall of rain • - Human interventions, such as deforestation, which cause the water to run-off faster than previously.
Different catchment areas. • Different catchment areas will have different flood hydrographs. Some, with steep slopes and little vegetation, will rise very quickly, and can be described as a “flashy river”. These are the most likely to flood. • Those drainage basins with shallower slopes, and greater vegetation cover will infiltrate the water more, and release it at a slower rate into the river. • This means there is less chance of flooding occurring.
Variations of different conditions. When rainfall is heavy and lasts a long time there will be a lot of run-off. Water will reach the river quickly, making the time lag short and discharge high. Rain will not be able to sink into the ground when it is frozen which will also mean that the time lag will be short. CONDITION 1: The weather
CONDITION 2: Nature of the catchment area. Impermeable rock does not allow water to pass through it and so a catchment area made of impermeable rock will have a lot of run-off. A catchment area made from permeable rock will allow infiltration to occur, reducing run-off and increasing the lag time. This will lower discharge in the river.
CONDITION 3: Land use. Trees in a river catchment area delays water by intercepting it. This reduces run-off and therefore time lag and river discharge. Where land has been built on by humans, time lag is shortened due to the covering of the ground by impermeable surfaces (tarmac and concrete for example). This will decrease the time lag and increase discharge.
CONDITION 4: River management Dams built across rivers will hold floodwaters back, therefore increasing the time lag and reducing peak discharge.

![Hydrographs [Date] Today I will: - Be able to construct and understand flood hydrographs](https://cdn3.slideserve.com/5580541/hydrographs-date-today-i-will-be-able-to-construct-and-understand-flood-hydrographs-dt.jpg)