Storm Hydrographs
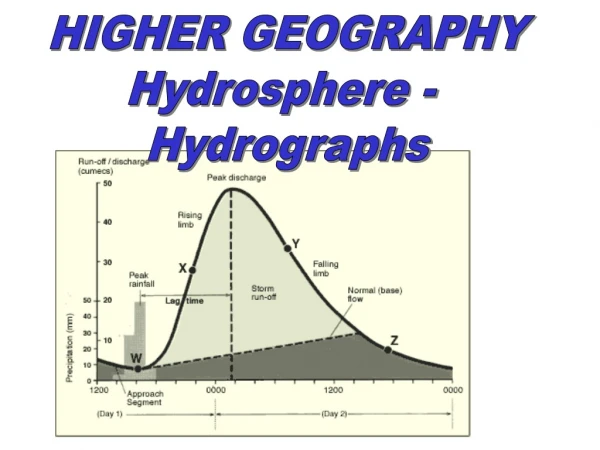
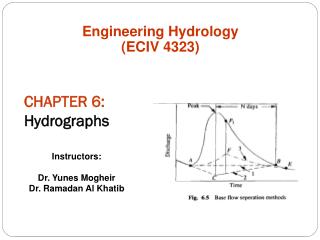
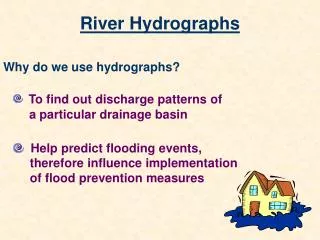
Storm Hydrographs. Aim: To recognise the recordings of a storm hydrograph and to understand its main features and how it can be influenced by h/p characteristics Case Study: Pakistan 2010. A Storm Hyrdograph. What do we mean by lag time, peak flow and recession/falling limb.

Storm Hydrographs
E N D
Presentation Transcript
Storm Hydrographs • Aim: To recognise the recordings of a storm hydrograph and to understand its main features and how it can be influenced by h/p characteristics • Case Study: Pakistan 2010
What do we mean by lag time, peak flow and recession/falling limb.
The Key Controls in a DB System Basin size, shape and relief Types of precipitation Temperature Land use Geology Soil Type Drainage Density Tides and storm surges
Key idea to remember • The eight controls set out on the previous slide should not be viewed in isolation to one another. It is rare that just one of these control mechanisms would contribute towards a major event in a drainage basin. • They should therefore be viewed as an interacting set of factors that contribute towards the behaviour of the basin.
Task • Use page 62-63 of Waugh – Integrated Approach to make notes on the 8 key DB factors. • Where possible, try to find an example (photo, graph or quote) to further illustrate the point.


![Hydrographs [Date] Today I will: - Be able to construct and understand flood hydrographs](https://cdn3.slideserve.com/5580541/hydrographs-date-today-i-will-be-able-to-construct-and-understand-flood-hydrographs-dt.jpg)