Download
1 / 30
300 likes | 341 Vues
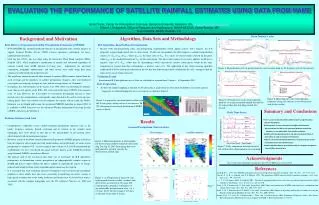
This paper discusses the use of satellite rainfall estimates to model storm hydrographs in a mid-size basin. It explores the limitations of operational rain-gauge networks and the advantages of satellite-based methods. The Auto-estimator technique and the OCINE2 Rainfall-Runoff Model are applied to obtain accurate accumulated precipitation estimates.

E N D
3rd Workshop of theInternational Precipitation Working GroupMelbourne, Australia, 23-27 October 2006 Modeling storm hydrographs in a mid-size basin using satellite rainfall estimates Daniel Barrera, Viviana Zucarelli and María V. Morresi Universidad Nacional del Litoral CONICET / Universidad de Buenos Aires ARGENTINA
Rainfall-runoff models of any type need rainfall areal estimates as input. • Characteristics of operational rain-gauge networks: • Low spatial density of stations • Irregular spatial distribution • Intrinsic characteristic of rainfall: • High spatial variability • Consequence: Important errors in areal rainfall estimates over sub-basins or other model input areas.
26 28 ) s e 30 e r g e d ( e d 32 u t i t a l h t u 34 o S 36 38 64 62 60 58 56 54 West longitude (degrees) Location of the Feliciano River Basin in the Province of Entre Ríos (Argentina)
Feliciano river basin. Sub-basins and drainage system. 30 30 31 ) S O D A 31 R G ( R U 31 S D U T I 31 T A L 31 31 60 60 59 59 59 59 59 59 59 59 59 59 58 Location of Feliciano river basin 30.0 31.0 32.0 A division in 17 sub-basins and basin segments was made for hydrologic modelling purposes 33.0 Lag time for this mid-size basin (5500 km2): ~ 4-5 days 34.0 60.0 59.0 58.0 WEST LONGITUDE (degrees)
On the other hand: Satellite-based methods of rainfall estimation at a pixel unit are affected by significant errors at present, which depend on the type of rain among other factors. Advantage over point observations: They provide full spatial coverage (precipitation estimations can be performed at all pixels) and account for spatial variability of rainfall. Therefore, they are more adequate to get the area-average rainfall over a sub-basin containing several to many pixels.
30.4 ) s e e r g e 30.6 d ( e d u t i t a l 30.8 h t u o S 31.0 59.6 59.4 59.2 59.0 58.8 58.6 58.4 West longitude (degrees) Location of pixel centers and Paso Medina station (outlet) over the watershed
Techniques to obtain accumulated precipitation estimates • at a given pixel consist on two steps: • Estimation of mean spatial rain rate at every pixel • Time integration over a lapse assigned to the analyzed image
The Auto-estimator techique (Vicente, Scofield and Menzel, 1998) with further modifications is called Hydro-estimator (HE). A version of this technique was developed at the University of Buenos Aires and is run operationally at the National Meteorological Service of Argentina. Auto-estimator technique: Designed to estimate convective rainfall in an operational way, accumulated on lapses lesser than 1 day, with a spatial resolution of 1 pixel (4km x 4km).
A power-law empirical function relates the brightness temperature at the cloud top with the rain rate at the cloud base Rc = ko exp (-a Tb1.2) The relationship applies to unicellular and multicell convective clouds (cumuloninmbus) at mature stage.
A further modification introduced the atmospheric precipitable water as a parameter family of curves Rc = ko exp (-a Tb1.2) ko , a functions of PW (Scofield and Kuligowski, 2003)
Satellite GOES East: 4 sectors of images generation Scanning frequency CONUS: 1 every 15 minutes SOUTHERN HEMISPHERE: 1 every 30 minutes over 70% of the time during the day. 1 every 90 minutes over the lasting 30% of the time. Source: NOAA / NESDIS
The image was sectorized in boxes of 4x4 degrees. • In order to determine the mean vector displacement of clouds on each box, two criteria were proposed, applied and tested. The vector difference (in pixel units) between pixels with cloud tops at the same tropospheric layer in both the analyzed and the precedent images was searched, which complies with one of the following conditions: • The maximum cross-correlation coefficient of temperature values at pixels in two consecutive images; and • The highest joint frequency of the same interval class of temperature (or same atmospheric layer) at pixels in two consecutive images.
Storm of April 10, 2002 Isoyetal map obtained from GOES images (procedure 1) (6hr period) Isoyetal map obtained from GOES plus synthetic images(procedure 2) (same period)
Estimated area-averaged rainfallover sub-basin 13Left bars: Procedure 1Right bars: Procedure 2
90 80 70 60 50 PP (mm) 40 30 20 10 0 1 2 3 4 5 6 7 8 9 Time in 6hr lapses Procedure 1 Procedure 2 6-hour lapses evolution of area-averaged rainfall. Procedure 1 andProcedure 2
OCINE2 Rainfall-Runoff Model It is a conceptual, pseudo-distributed parameters model developed by the project team, which computes both overland flows and stream flows by applying the kinematic wave theory.
Basic equations Continuity for stream segment Continuity for catchment segment Momentum for stream segment Momentum for catchment segment x: distance along the stream segment (m);Q: runoff in the stream segment (m3/sec) ; A: area of the wetted stream cross-section (m2) ; q: discharge per unit width in the catchment segment (m2/sec); y: average depth of flow (m);p: rainfall rate (mm/hr); f: infiltration rate (mm/h); ac, mc, as, ms, are calibration parameters for the catchment and stream segments, respectively.
APPLICATION TO THE FELICIANO RIVER BASIN WITH OUTLET IN PASO MEDINA STATION As part of the calibration process, a segmentation in 17 sub-basins was performed after an analysis of the dynamics of hydrological responses to rainfall inputs. A Topologic framework with 51 segments (34 for overland flow and 17 for stream flow) was utilized.
Storm hydrographs modelled. Due to a lack of information about soil characteristics and soil moisture conditions previous to the storm to be modelled, it is not possible at this stage to predict the runoff component of the rainfall. Therefore, for each of the cases modelled, the volume of the simulated hydrograph has been adjusted to match the volume of the observed hydrograph in order to evaluate the model skill in predicting the distribution of that runoff in time, that is, the shape of the storm hydrograph.
Observed and simulated hydrographsStorm starting on April 9, 2002
Observed and simulated hydrographsStorm starting on April 22, 2002
Observed and simulated hydrographsStorm starting on December 28, 2002
Observed and simulated hydrographsStorm starting on March 9, 2003
Observed and simulated hydrographsStorm starting on April 23, 2003