Download
1 / 55
550 likes | 590 Vues
Explore the validation of satellite-derived rainfall estimates and numerical model forecasts of precipitation over the US, highlighting insights into accuracy and biases. Learn more from the Climate Prediction Center. Full details at www.bom.gov.au.

E N D
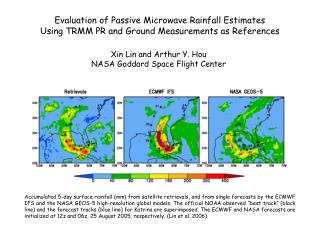
Validation of Satellite-Derived Rainfall Estimates and Numerical Model Forecasts of Precipitation over the US John Janowiak Climate Prediction Center/NCEP/NWS 2nd Int’l Precipitation Working Group - October 26, 2004
Work is modeled after the pioneering effort of Dr. Beth Ebert (BMRC/Australian BOM) www.bom.gov.au/bmrc/wefor/staff/eee/SatRainVal/dailyval_dev.html U.S. Validation at: www.cpc.ncep.noaa.gov/products/janowiak/us_web.shtml
Validation Data Set Typical Station Distribution • - 7000+ station reports daily • 06Z – 06Z accumulation period • Data analyzed using a Cressman-type • scheme • Error characteristics of validation data are • NOT known • - Validation area matched for all estimates • (if missing in one, made missing in all)
Validation Data Set Typical Station Distribution
CPC gauge analysis ( Aug 2003) CMORPH analysis ( Aug 2003) CMORPH with evap. adjustment
west Bias Ratio (areal coverage) east
west east BIAS Ratio (estimated mean / gauge mean)
Mean precip. for entire US (not to scale)
Contribution to June 2004 Total Rainfall by Daily Rainfall Amount Heaviest 10% of daily rainfall events
CONCLUSIONS 1. Merging PMW & IR estimates provides more accurate estimates of precipitation than the separate components can
CONCLUSIONS 1. Merging PMW & IR estimates provides more accurate estimates of precipitation than the separate components can 2. Two major systematic biases are apparent in the satellite estimates: a. OVERestimation over snow-covered regions b. OVERestimation in semi-arid regions during the warm season
CONCLUSIONS 1. Merging PMW & IR estimates provides more accurate estimates of precipitation than the separate components can 2. Two major systematic biases are apparent in the satellite estimates: a. OVERestimation over snow-covered regions b. OVERestimation in semi-arid regions during the warm season 3. NWP forecasts generally outperform blended satellite estimates and radar during the winter season over the U.S.
Probability of Detection/False Alarm Ratio east POD west FAR
Probability of Detection/False Alarm Ratio east POD west FAR
Probability of Detection/False Alarm Ratio July 2004 POD FAR
Probability of Detection/False Alarm Ratio July 2004 POD FAR January 2004
CMORPH vs. gauge over ‘NAME*’ zones *North American Monsoon Experiment (2004)
CPC gauge analysis ( Aug 2003) CMORPH analysis ( Aug 2003)
Statistics over 9 NAME Zones Evap. adjusted Evap. adjusted
Distribution of Daily Precipitation Amounts for June 2004 45 50 55 60 65 70 75 80 85 90 >90