Download
1 / 1
10 likes | 160 Vues
Validation of Satellite-Derived Cloud Top Heights in Tropical Cyclones using Observations from the NASA Global Hawk and CALIPSO Sarah A. Monette* , Christopher S. Velden* , Andrew Heidinger^, Edward J. Zipser , Daniel J. Cecil ✚ , Peter G. Black # , Scott A. Braun ★

E N D
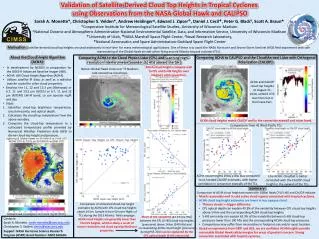
Validation of Satellite-Derived Cloud Top Heights in Tropical Cyclones using Observations from the NASA Global Hawk and CALIPSO Sarah A. Monette*, Christopher S. Velden*, Andrew Heidinger^, Edward J. Zipser, Daniel J. Cecil✚, Peter G. Black#, Scott A. Braun★ *Cooperative Institute for Meteorological Satellite Studies, University of Wisconsin-Madison ^National Oceanic and Atmospheric Administration-National Environmental Satellite, Data, and Information Service, University of Wisconsin-Madison University of Utah, ✚NASA Marshall Space Flight Center, #Naval Research Laboratory, ★National Aeronautics and Space Administration-Goddard Space Flight Center Motivation: Satellite-derived cloud top heights are used extensively in real-time for many meteorological applications. One of these is to assist the NASA Hurricane and Severe Storm Sentinel (HS3) field experiment with safe maneuvering of the Global Hawk aircraft when flying around Atlantic tropical cyclones (TCs). About the Cloud Height Algorithm (ACHA): Comparing ACHA to CALIPSO and the Cloud-Aerosol Lidar with Orthogonal Polarization (CALIOP): Comparing ACHA to the Cloud Physics Lidar (CPL) and Scanning High -resolution Interferometer Sounder (S -HIS) aboard the GH : • In development by NESDIS in preparation for the GOES-R Advanced Baseline Imager (ABI). • ACHA: ABI Cloud Height Algorithm (ACHA) • Utilizes satellite IR data, as well as a radiative transfer model for other cloud properties. • Employs the 11, 12 and 13.3 µm (Meteosat) or 6.7, 11 and 13.3 µm (GOES) or 6.7, 11 and 12 µm (MTSAT) LW-IR band, so can operate night and day. • Steps: • Identifies cloud-top brightness temperature, cloud emissivity, and optical depth. • Calculates the cloud-top temperature from the above variables. • Compares the cloud-top temperature to a collocated temperature profile provided by Numerical Weather Prediction data (GFS) to derive cloud-top height and pressure. ACHA cloud heights compare well to CPL and S-HIS heights over Nadine’s cold convection. Below: Global Hawk track over TS Nadine’s cold convective cloud tops. ACHA and CALIOP cloud top heights on August 31, 2010, at 0615 UTC over then Cat-4 Hurricane Earl. ACHA cloud heights match CALIOP well in the convective eyewall and outer band. Comparisons from 42 West Pacific TCs ACHA cloud heights show a low bias compared to co-located CALIOP estimates, with higher correlation in convective eyewalls of the TCs. Like ACHA, CloudSat is better correlated with the CALIOP cloud height in the eyewall of the TCs. • Summary: • Comparison of ACHA cloud height estimates with Global Hawk CPL/S-HIS and CALIOP indicate: • Match reasonably well in cold active cloud regions associated with tropical cyclones. • ACHA cloud top height estimates are lower in less opaque cloud. • Thinner clouds >> bigger difference • CPL optical depth can explain 43.3% of the variability between CPL cloud-top heights above 14 km and the corresponding ACHA cloud-top heights. • S-HIS emissivity can explain 62.9% of the variability between S-HIS cloud-top pressures lower than 140 hPa and the corresponding ACHA cloud-top pressures. • Comparisons may suffer from mismatches in footprint size and/or exact location. • Based on experience from GRIP and HS3, we are confident ACHA heights provide reasonable Global Hawk safety margins for areas of greatest concern: Strong convection associated with tropical cyclones. Comparison of collocated cloud-top height estimates by ACHA with CPL cloud-top heights above 14 km. Sample is from GH over-flights of TCs during the 2013 Atlantic field campaign. ACHA cloud heights are generally lower than the CPL heights, which is likely a result of sensor resolution and cloud opacity/thickness properties. Global Hawk investigates Hurricane Ingrid (2013). Much of the variability [43.3% (62.9%)] between the CPL (S-HIS) cloud-top heights (pressures) above 14 km (140 hPa) and corresponding ACHA cloud height (pressure) during HS3 2013 can be explained by the CPL optical depth (S-HIS emissivity). Contacts: Sarah A. Monette sarah.monette@ssec.wisc.edu Christopher S. Velden: chrisv@ssec.wisc.edu Support: NASA Hurricane Science Research Program (HSRP) Grant Number: NNX12AK63G