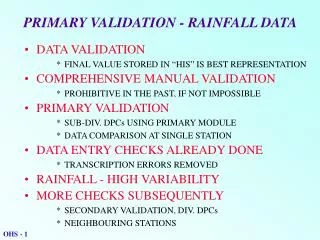
Download
1 / 25
260 likes | 379 Vues
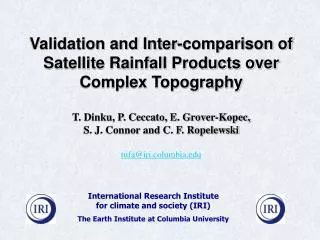
Validation and Inter-comparison of Satellite Rainfall Products over Complex Topography T. Dinku, P. Ceccato, E. Grover-Kopec, S. J. Connor and C. F. Ropelewski tufa@iri.columbia.edu. International Research Institute for climate and society (IRI)

E N D
Validation and Inter-comparison of Satellite Rainfall Products over Complex Topography T. Dinku, P. Ceccato, E. Grover-Kopec, S. J. Connor and C. F. Ropelewski tufa@iri.columbia.edu International Research Institute for climate and society (IRI) The Earth Institute at Columbia University
Motivation • Questions from users of IRI Data Library on quality of the different rainfall estimates • IRI uses/intends to use satellite rainfall estimates mainly fro famine early warning and epidemic (Malaria/Rift valley fever) monitoring • Which data should be use • Plans to help NMS to merge their gauge data with the “best” satellite product • Which is the best product?
Outline • Study region • Gauge and satellite data used • Monthly products at 2.5-deg resolution • Ten-daily accumulation at 1-deg resolution - Effects of topography, PM input and Calibration • Daily products at 0.25 degree • Summary
Study areas Ethiopia Zimbabwe
Ethiopia: Mean Annual Rainfall New_LocClim (FAO)
Ethiopia: Topography vs. Rainfall NewLocClim New_LocClim (FAO)
22 35 39 Elevation [meters] 22 Raingauge Used • Gauge Data • -147 Station total, 120 used • - 1990-2004 for monthly @ 2.5 deg • 2000-2004 for 10-daily @ 1 deg • 2003 and 2004 for daily at 0.25 deg • Gauge data gridded using Climate Aided Interpolation • Kriging for interpolating the means • Angular-Distance Weighting for anomalies
Monthly at 2.5-degree (1/2) Data: 1998-2004
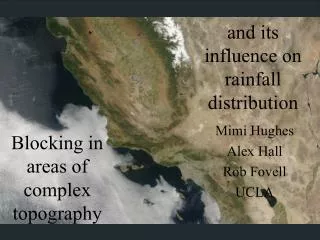
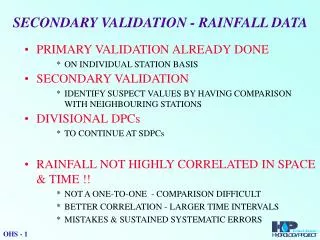
10-day @ 1o x 1o RFE1 vs RFE2: Effect of topography Data: March to September 2000
10-day @ 1o x 1o RFE2vs ARC: Effect of PM data and sampling?
10-day @ 1o x 1o RFE2 vs 3B42RT: Effect of calibration(?)
10-day @ 1o x 1o 1DD, 3B42, TAMSAT and CMORPH
. -20 .-30 О-40 .-50 .-60 Ethiopia: CCD Thresholds(oC)
10-day @ 0.25o RFE2, 3B42, CMORPH
Daily @ 0.25o Ethiopia
Zimbabwe: - 43 Stations(12 GTS) - No griding - Data from Jan, Feb, Mar, Nov & Dec 2003
Summary Results very good for monthly products @ 2.5 deg, good for 10-day products @ 1 deg, but poor for the daily products @ 0.25 deg There is significant influence of topography, which should be taken into account Spatially (and temporally) varying temperature thresholds and regression parameters improve the accuracy significantly. -> TAMSAT performed as well as CMORPH