Download
1 / 18
190 likes | 396 Vues
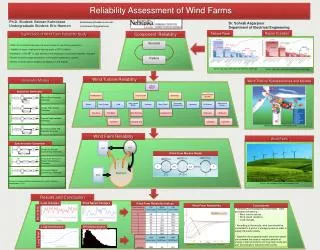
Operational and Reliability Analysis of Offshore Wind Farms. Has availability gone with the wind? Christopher J. Crabtree, Durham University, UK EWEA 2012 17 th April 2012. Wind in the UK. Operational Capacity Onshore: 4.25 GW Offshore: 1.52 GW Under Construction or Consented

E N D
Operational and Reliability Analysis of Offshore Wind Farms Has availability gone with the wind? Christopher J. Crabtree, Durham University, UK EWEA 2012 17th April 2012
Wind in the UK • Operational Capacity • Onshore: 4.25 GW • Offshore: 1.52 GW • Under Construction or Consented • Onshore: 5.37 GW • Offshore: 3.92 GW • Planned • Onshore: 7.66 GW • Offshore: 2.28 GW • Round 3 Offshore: up to 25 GW
Capacity Factor and Cost of Energy • Average capacity factor: • Onshore (DECC) = 27.3% • Round 1 offshore = 29.5% • Expected offshore = 35.0% • Average cost of energy: • Onshore (2006) = £47 per MWh • Round 1 offshore = £69 per MWh • What might be affecting capacity factor and cost of energy?
Availability and Capacity Factor • Capacity factor depends upon availability • Large variations in availability • What is causing availability to vary? • ‘Seasonal’ variations are not consistent • What about the wind conditions? • What is the result?
Availability and Unworkable Days No relationship Water depth = 3.6m
Availability and Unworkable Days No relationship Water depth = 3.6m Decreasing availability Water depth = 9.8m
Availability and Unworkable Days No relationship Water depth = 3.6m Decreasing availability Water depth = 9.8m Significantly decreasing availability Water depth = 12.8m
Conclusions • Offshore wind is achieving higher capacity factors than onshore • Highly variable availability • Season and wind speed dependent • Large energy losses at certain wind speeds • Wind speed, water depth and unworkable days are linked • Stops must be occurring at higher wind speeds • A reliability problem • Unable to access turbines for repair • An operations problem
Operational and Reliability Analysis of Offshore Wind Farms Thank you for listening Dr Christopher J. Crabtree c.j.crabtree@durham.ac.uk