Download
1 / 16
160 likes | 182 Vues
This presentation provides an overview of the New Jersey State Learning Assessment (NJSLA) results for the Fairview School District, showcasing the performance levels and outcomes in English Language Arts/Literacy and Mathematics. It also includes a parent guide to score reports and subgroup outcomes for students with disabilities, economically disadvantaged students, English language learners, and Hispanic students.

E N D
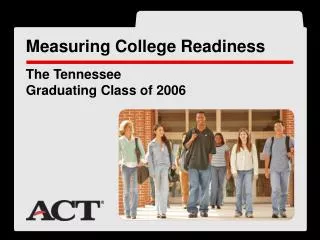
NJSLA, NJSLA-S, ACCESS for ELL’s State ASSESSMENT RESULTS: PRESENTATIONFAIRVIEW SCHOOL DISTRICTOCTOBER 1, 2019 Measuring College and Career Readiness
NJSLA PERFORMANCE LEVELS • Level 1: Not yet meeting grade-level expectations • Level 2: Partially meeting grade-level expectations • Level 3: Approaching grade-level expectations • Level 4: Meeting grade-level expectations • Level 5: Exceeding grade-level expectations
NEW JERSEY’S 2019 NJSLA OUTCOMESENGLISH LANGUAGE ARTS/LITERACY Note: Numbers may not sum to 100% due to rounding.
NEW JERSEY’S 2019 NJSLA OUTCOMES MATHEMATICS * Note: Approximately 30,000 New Jersey students participated in the NJSLA Algebra I assessment while in middle school. Thus, NJSLA Math 8 outcomes are not representative of grade 8 performance as a whole. Note: Numbers may not sum to 100% due to rounding.
FAIRVIEW’S 2019 NJSLA GRADE-LEVEL OUTCOMESENGLISH LANGUAGE ARTS/LITERACY
HOW TO HELP YOUR CHILD http://understandthescore.org/
FAIRVIEW’S 2019 NJSLA SUBGROUP OUTCOMESENGLISH LANGUAGE ARTS/LITERACY
Fairview Subgroup Trends 2019 • Students with disabilities math NJSLA scores in grades 3-5 have been stable since 14-15 with 6% meeting or exceeding proficiency levels, 15-16 7%, 16-17 7%, 2017-18 7% and 2018-2019 8 %. Grades 3-5 ELA scores have improved since 14-15 with 5% meeting or exceeding, 15-16 11%, 16-17 15% ,17-18 15% and 18-19 4 %. Grades 6-8 math scores have improved from 14-15 0% meeting or exceeding , 15-16 0%, 16-17 6%, 17-18 7% and 18-19 7 %. Grades 6-8 ELA scores have improved slightly from 14-15 with 6% meeting or exceeding, 15-16 2%, 16-17 10% , 17-18 10% and 18-19 10 %. • Economically disadvantaged students math NJSLA scores in grades 3-5 have improved since 14-15 with 19% meeting or exceeding proficiency levels, 15-16 27%, 16-17 24% ,2017-18 27% and 18-19 27%. Grades 3-5 ELA scores have improved since 14-15 with 29% meeting or exceeding, 15-16 37%, 16-17 39%, 17-18 39% and 18-19 32 %.Grades 6-8 ELA scores have steadily improved: 14-15 25% meeting or exceeding,15-16 33%, 16-17 38% , 17-18 39% and 18-19 38 %. Grades 6-8 math scores have improved: 14-15 12% meeting or exceeding, 15-16 15%, 16-17 20% ,17-18 27% and 18-19 28 %. English language learners math NJSLA scores in grades 3-5 have not shown growth since 14-15 with 0% meeting or exceeding proficiency levels, 15-16 3%, 16-17 2 %, 2017-18 1% and 18-19 2 %. Grades 3-5 ELA scores have not shown growth since 14-15 with 0 % meeting or exceeding, 15-16 0%, 16-17 5%, 17-18 3% and 18-19 3 %. Grades 6-8 ELA scores have not shown growth: 14-15 0% meeting or exceeding,15-16 0%, 16-17 3%, 17-18 7% and 18-19 8 %. Grades 6-8 math scores have not shown growth: 14-15 0% meeting or exceeding, 15-16 0%, 16-17 1%, 17-18 2% and 18-19 3 %. Hispanic students math NJSLA scores in grade 3 have trended lower since 16-17 and in the Spring of 2018 33.5% of students scored proficient and did not meet the annual target of 39.5%. Math NJSLA scores in grades 4-8 have trended lower since 16-17 and in the Spring of 2019 21.8% of students scored proficient and did not meet the annual target of 23.8% . ELA scores in grade 3 have been stable since 16-17 and in the spring of 2018 34.7% of students scored proficient exceeding the annual target of 33.7%. In grades 4-8, ELA scores have trended lower since 16-17 and in the Spring of 2018 35.3% scored proficient and did not meet the annual target of 39.6%