Download
1 / 47
470 likes | 635 Vues
MONTANA TRAVEL. Presented by: Mary Jo Torrey Manager, Cooperative Research. Discussion Topics . TravelScope TravelScope EXPRESS software Montana Travel Analysis. Cooperative Research Program. ®. TRAVELSCOPE. Provides quantitative data on U.S. Domestic travel volume,

E N D
MONTANA TRAVEL Presented by: Mary Jo Torrey Manager, Cooperative Research
Discussion Topics • TravelScope • TravelScope EXPRESS software • Montana Travel Analysis
Cooperative Research Program ® TRAVELSCOPE Provides quantitative data on U.S. Domestic travel volume, trip characteristics, and travel patterns at the national and state levels.
Monthly Survey • 25,000 households surveyed each month • 70% response rate allows analysis of 5,000 U.S. traveling households per month, on average • Over 60,000 traveling households and 85,000 trips per year • Statistical reliability +/-.4%. * * At 95% confidence level
DATA MANAGEMENT • Uses NFO consumer panel • Uses experienced firm to process the data; sends clean data files to TIA • TIA continuous internal reviews • Monitor weights, response rates, Pleasure/ Business, Air/Auto and Hotel trends • Comparisons to external data: • Air Transport Association • Smith Travel Research • Other industry indicators
SURVEY DESIGN • Limited recall required— • One month, up to three trips • Held to strict design standards to facilitate comprehension and use Smaller than actual size
Provides easy access to TravelScope data
Data Based to... • Total U.S. travel (including outbound) • Domestic U.S. travel* • Individual states • Data provided for all 50 destination states • Detailed crosstabulations of data by various travel segments (e.g. business, pleasure, hotel) for each subscribing state or city * Includes data from the 48 contiguous states to any of the 50 U.S. states.
Provides Trip Characteristics... Purpose Transportation Mode Travel Party Places Visited Trip Duration Lodging Activities DMA of Origin MSA of Destination For Example:
…and Household Demographics... For Example: Age of Household Head Marital Status Presence of Children Household Size Education of Household Head Average Household Income
...for a Variety of Travel Segments For Example: Total Pleasure Business Air Auto Hotel HH Head Aged 35-54 HH Income $50,000 and over
DEFINITIONS Analysis in this presentation are based on TravelScope data from Quarter 4, 2000 through quarter 3, 2002. • 2001x indicates data from Q4-2000 through Q3-2001 • 2002x indicates data from Q4-2001 through Q3-2002 Source: TIA’s TravelScope
SAMPLE SIZES The data include a total of 2,541 raw person trips from 1,174 unique household trips Non-resident data are based on: • 293 household/ 631 person trips for 2001x • 349 household/714 person trips for 2002x Source: TIA’s TravelScope
Travel Decline in 2002 Source: TIA’s TravelScope
TripCharacteristics of Montana Visitors Source: TIA’s TravelScope
Resident and Non-resident Travel Trends Differ 2001x 2002x % change Residents 4.0 million 2.9 million -28% Non-residents 3.8 4.3 14% numbers in millions Source: TIA’s TravelScope
Smaller Share of Resident Travelers Source: TIA’s TravelScope
Most Trips Are For Leisure Purposes Source: TIA’s TravelScope
Two of Five Non-Resident Travelers Are Visiting Family/Friends Source: TIA’s TravelScope
Most Visitors Travel By Car/Truck Montana Travel Advisory Committee Meeting, February 3-4, 2003 Source: TIA’s TravelScope
An Average Trip Lasts 3.5 nights Average Trip Duration 2001x 2002x % change MONTANA 2.4 nights 2.7 nights 12% Colorado 3.4 3.0 -12% Wyoming 2.0 2.4 20% Idaho 2.0 2.1 5% Source: TIA’s TravelScope
Over Half of Overnight Visitors Stay in a Hotel, Motel or B&B Source: TIA’s TravelScope
Outdoor Activities Are Popular with Non-Resident Visitors... Source: TIA’s TravelScope
… and with Resident Travelers Source: TIA’s TravelScope
Non-Resident Travelers Spend More* • Non-Resident visitors to Montana spend, on average, $404 per household per trip • Resident travelers in the state spend, on average, $315 per household per trip. * Spending at the destination. Does not include transportation costs to travel to the destination.
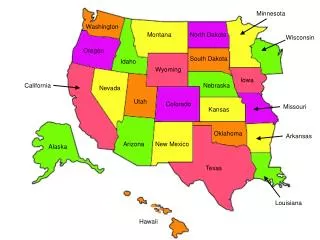
Top 10 Origin States State of Origin (percent of person-trips) MONTANA residents 40% Washington 17% Idaho 7% California 4% Oregon 4% Wyoming 3% Utah 3% Colorado 3% Minnesota 2% Illinois 2% 10 State Total = 85% Source: TIA’s TravelScope
MT ID WY CO Competing for Travelers Top Five States of Origin (excluding residents) Montana Wyoming Colorado Idaho Washington Utah California Washington Idaho Colorado Texas Utah California California New Mexico Oregon Oregon Montana Wyoming California Wyoming Washington Nebraska Montana
Top Origin DMA’s (percent person-trips) Great Falls 11% Missoula 10% Billings 10% Butte-Bozeman 5% Helena 4% Spokane 11% Seattle-Tacoma 8% Salt Lake City 3% Portland, OR 3% Denver 3% Also a top origin market for... ID ID WY, ID, CO CO, WY Source: TIA’s TravelScope
The Non-Resident Traveler • Aged 48 years, on average, with an average annual HH income of $63,900 • Almost two in five households (39%) have children in the home; 28% of person-trips include children • On average, 2.2 people from the household are in the travel party Source: TIA’s TravelScope
The Resident Traveler • Aged 47 years, on average, with average annual HH income of $48,000 • Almost two in five households (37%) have children in the home; 20% of person-trips include children • On average, 1.9 people from the household are in the travel party
PRIZM Segments A geodemographic market segmentation system, based on the principle that people with similar socioeconomic backgrounds and consumer behavior, cluster or move into neighborhoods best suited to their chosen lifestyles. Developed by Claritas Inc.
Geodemographic Segmentation Systems Geo - Geography clusters are formed on the basis of where people live Demographic - clusters are described demographically Segmentation - breaks the US population into segments or “clusters”
PRIZM is a segmentation system that classifies every ______________ in the US into one of 62 clusters. neighborhood cluster and every ______________ into one of 15 social groups.
History of PRIZM • First PRIZM model: early 1970s • Rebuilt with each Census: 1980 and 1990 • Major demographic shifts • New Clusters, deleted Clusters • Model refinements • Annually updated for every... • ZIP Code • Census Tract • Census Block Group • Census Block
Why is geodemographic mapping useful? • Shows where your customers - or people just like them - live & how this matches your product distribution • Also shows demographic characteristics of the population in a tightly defined area of geography around your locations
Top 5 PRIZM Social Groups 2002x Non-Resident Travelers to Montana —— by PRIZM Social Group —— Social Group Share of person-trips Landed Gentry 11% 2nd City Centers 11% Elite Suburbs 10% Heartlanders 10% 2nd City Society 8% Source: TIA’s TravelScope
Affluent PRIZM Social Groups Visit Montana
Landed Gentry Elite Suburbs Mostly large, multi-income families with school-aged kids, headed by executives, professionals and “techies” Landed Gentry tend to: Affluent households who tend to live in the suburbs of major metropolitan areas Elite Suburbs tend to: • Shop or bank online • Participate in sports such as cross country or downhill skiing and golf • Listen to all sports or classic rock radio • Read Traditional Home • Participate in sports such as tennis, golf or skiing • Use a rental car • Belong to a frequent flyer program or a health club • Listen to news/talk radio • Read USA Today, Travel & Leisure, Conde Nast Traveler Source: Claritas with Mediamark Research, Inc, and Simmons Market Research
2nd City Centers 2nd City Society Midscale households in middle-density, satellite of second-tier cities 2nd City Centers tend to: Highly educated, high income households that top the economic scale of second-tier and satellite cities 2nd City Society tend to: • Travel by bus, railroad, or car with camping equipment • Participate in sports such as jogging, running, racquetball, snowmobiling or skiing • Be fans of college basketball or truck racing/pulling • Listen to variety radio • Read Skiing, Shape or Saturday Evening Post • Belong to an auto club • Be very brand loyal • Use coupons • Listen to nostalgia radio • Read Tennis, Bon Appetit or Forbes Source: Claritas with Mediamark Research, Inc, and Simmons Market Research
Heartlanders Large multi-generational families living in low-density homes mostly in the Great Plains, South Central, Mountains and Pacific area. Heartlanders tend to: • Travel by car with camping equipment or by railroad • Participate in activities such as snowmobiling or hunting • Listen to country radio • Watch nostalgia TV • Read Saturday Evening Post, Popular Photography, Country Living or Organic Gardening Source: Claritas with Mediamark Research, Inc, and Simmons Market Research
www.TIA.org Mary Jo Torrey mtorrey@tia.org