Download
1 / 70
720 likes | 1.01k Vues
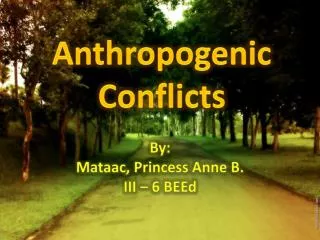
Anthropogenic Effects (Terrestrial). Human Population Growth. Probably the largest ecological problem the Earth is facing today Each individual requires a minimum amount of resource Food, water, shelter, fuel

E N D
Human Population Growth • Probably the largest ecological problem the Earth is facing today • Each individual requires a minimum amount of resource • Food, water, shelter, fuel • If the human population exceeds the carrying capacity, the population will be forced to decline
Carrying Capacity – the maximum population size that a particular environment is able to maintain for a given period. • At population sizes greater than the carrying capacity, the population decreases • At population sizes less than the carrying capacity, the population increases • At population sizes = the carrying capacity, the population is stable • Equilibrium Point – the population density that = the carrying capacity.
Cultural Carrying Capacity • ‘There should be no more people in a country than could enjoy daily a glass of wine and piece of beef for dinner.’ • Robert Malthus (~1805) • We could live at the maximum carrying capacity and devote all of our farmland to growing food for direct human consumption (all bread and water, no wine and steak) • But is this what we want?
Human Population Growth • Estimated at 6.1 billion in 2000 • Growing approximately 1.33% per year (214,000 per day) • Population will double in about 52 years • Growth is actually greater than exponential growth • No population can continue to grow without limit
(2000) Earth’s Carrying Capacity • Difficult to estimate (what will be the limiting factor?) • Most estimates predict about 10 – 12 billion people
Ecological Footprint • Ecological footprint – amount of land needed to produce the resources needed by the average person in a country • Methods: • Correct consumption data for trade imports and exports Consumptionwheat= production + imports – exports • Convert to land area needed to produce the item Awheat = Cwheat / ywheat A=total area needed, C=consumed, Y=yield • Obtain per capita ecological footprint by dividing by population size fwheat = awheat/population size
Ecological footprint in relation to available ecological capacity.
Per Captia Ecological Footprint (Hectares of land per person) Country 10.9 United States 5.9 The Netherlands 1.0 India Total Ecological Footprint (Hectares) Country 3 billion hectares United States 94 million hectares The Netherlands 1 billion hectares India It would take about 3 times the current land area of Earth if all 6.1 billion people consumed the same as the 276 million people in the US
Resources • Ecological Resource – anything an organism needs for normal maintenance, growth, and reproduction • Economic Resource – anything obtained from the environment to meet human needs and wants • Food, water, shelter, manufactured goods, transportation, communication, and recreation
Resource Classification • Perpetual resource – continually renewed on a human time scale • Solar energy, wind • Renewable resource – can be replenished as long as harvest is sustainable • Timber, fisheries, fresh water • Non-renewable resource – exist in a fixed stock • Fossil fuels, metals
Resources Perpetual Nonrenewable Non- metallic minerals Metallic minerals Fossil fuels Winds, tides, flowing water Direct solar energy (iron, copper, aluminum) (clay, sand, Phosphates) Renewable Fresh air Fresh water Fertile soil Plants and animals (biodiversity)
Ecosystem Degradation • When environmental conditions become altered in such a way that they exceed the range of tolerances for one or more organisms in the biotic community, the ecosystem becomes degraded. • Loses some capacity to support the diversity of life forms that are best suited to its particular physical environment.
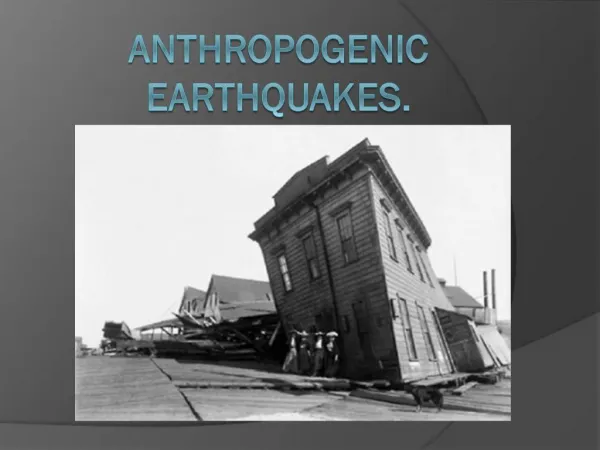
Anthropogenic • Ecosystems can be degraded by natural catastrophes • Volcanoes, earthquakes, hurricanes • When ecosystem degradation is human-induced, we call that anthropogenic effects. • Waste disposal, dam construction, wetland drainage • Cannot control natural degradation, but we can control our activities.
Ecosystem Damage • Adverse alteration of a natural system’s integrity, diversity, or productivity. • Pollution is the major cause of environmental damage • Pollutant – a substance or form of energy, such as heat, that adversely alters the physical, chemical, or biological quality of natural systems or that accumulates in the cells or tissues of living organisms in amounts that threaten their health or survival
Acute Pollution Effects • Occur immediately upon or shortly after the introduction of the pollutant. • Death is usually the effect • Nitrite 96 hour LC50 acute toxicity. • Twenty five million gallons of North Carolina hog sewage.
Chronic Pollution Effects • Act in the long term; they are not noticed until several months, years or decades after the introduction of the pollutant. • Nitrite slows fish growth chronic toxicity • Synergistic Effect – combined effect of two chemicals is greater or more harmful than the sum of their individual effects.
Bioaccumulation • The storage of chemicals in an organism in higher concentrations than are normally found in the environment. • N and P is found in higher concentrations of phytoplankton than in the environment • Actively concentrate (transport) N and P across their cell membranes • Fat soluble compounds also move across cell membranes and dissolve in fats (lipids). • Tend to stay in the organism and thus accumulate • If they were soluble in water, then they would flush out • DDT and PCB’s bioaccumulate.
Bioaccumulation of Tributylin (TBT) • TBT is a chemical found in nautical paint that was found in oysters along the coast of California in the late 1980s’. • Probably caused shell thickening and chamber malformations • Some oysters had TBT concentrations 30,000 times higher than in the water.
Bioaccumulation of Nitrite • Nitrite is taken up by chloride cells • Actively transported • Acutely toxic to shortnose sturgeon fingerlings • 96 hour LC50 = 11.3 ± 8.17 mg/L • When exposed to 2.17 mg/L for 5 days, nitrite levels in the blood plasma were 63 times the concentration in the water.
Biomagnification • Defined as the accumulation of chemicals in organisms in increasingly higher concentrations at successive trophic levels. • Consumers at higher trophic levels ingest a significant number of individuals, along with the fat-soluble pollutants stored in their tissue. • Top carnivores may accumulate poisons in concentrations high enough to prevent their eggs from hatching, cause deformities, or even death. • Concentrations in predators can be a million times higher in predators than the concentration in the soil or the water
Terrestrial Biomagnification • DDT used to control elm bark beetle (Dutch elm disease).
Aquatic Biomagnification • PCB’s dumped into the Great Lakes and move through the food chain One of the reasons the Brown Pelican became endangered.
Brown Pelican Recovery • The Brown pelican was abundant in LA in 1950. • Texas populations significantly declined between 1957 and 1961. LA’s population was eliminated. • Listed as endangered in the US on October 13, 1970 • Primary cause of decline was pesticides: DDT compounds (DDE and DDD), and PCB’s (dieldrin and endrin). • These chemicals were moved through the food chain • Impaired reproductive success (egg shells became very thin and would often collapse) • Populations have since recovered • DDT banned in 1972 • Egg shells have shown increasing thickness
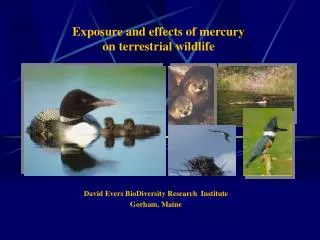
Environmental Mercury • Usually implicated in fish consumption advisories: 1.0 ppm methyl mercury warrants fish consumption advisories in the US. • Natural Sources: • Volcanoes, soil, under sea vents, mercury-rich geologic zones, freshwater, oceans, plants, forest fires etc. • Anthropogenic Sources • Mining and industrial applications, waste incineration, coal-fired plants, paint, thermometers, etc.
Mercury Chemistry • Elememental mercury (Hg0) • Most common form of environmental mercury • High vapor pressure, low solubility, does not combine with inorganic or organic ligands, not available for methylation • Mercurous Ion (Hg+) • Combines with inorganic compounds only • Can not be methylated • Mercuric Ion (Hg++) • Combines with inorganic and organic compounds • Can be methylated
Methylation • Basically a biological process by microorganisms in both sediment and water • Influenced by environmental variables that affect both the availability of mercuric ions for methylation and the growth of the methylating microbial populations. • Rates are higher in anoxic environments, freshwater, and low pH • Presence of organic matter can stimulate growth of microbial populations, thus enhancing the formation of methylmercury (sounds like a swamp to me!)
Methylation • Biological methylmercury production can vary due to seasonal changes in: • Nutrients, oxygen, temperature, and hydrodynamics • Measurements of total mercury concentrations in the sediment do not provide information on the form of mercury present, methylation potential, or availability to organisms locally and downstream. • If environmental conditions are conducive for methylation, methylmercury concentrations may be high in proportion to the supply and distribution of total mercury
Methylmercury Bioaccumulation • Mercury is accumulated by fish, invertebrates, mammals, and aquatic plants. • Inorganic mercury is the dominate environmental form of mercury, it is depurated about as fast as it is taken up so it does not accumulate. • Methylmercury can accumulate quickly but depurates slowly, so it accumulates • Also biomagnifies • Percentage of methylmercury increases with organism’s age.
Methylmercury Bioaccumulation • Uptake and depuration rates vary between tissues within an organism. • Partitioning of mercury between tissues within aquatic organisms is influenced by the chemical form of mercury and route of exposure (diet or gills). • About 99% of mercury found in fish muscle tissue is methylmercury (due to its preferential uptake, ability to be transferred among tissues, and slow depuration). • Marine mammals have among the highest concentrations of mercury found in all marine organisms (liver highest concentration) • Invertebrates usually have a lower percentage (of total mercury) of methylmercury in their tissues than do fish and marine mammals. • This percentage can greatly vary from 1% in deposit feeding polychaetes to close to 100% in crabs.
Methylmercury Bioaccumulation • Sediment is main source of mercury, but the foodweb is the main pathway for aquatic systems. • High trophic level species tend to accumulate the highest concentrations of mercury. • Fish-eating predators have the highest • Mercury concentrations in higher trophic species often do not correlate with concentrations in environmental media. • However, correlations have been made between sediment and lower trophic species that typically have a high percentage of inorganic mercury, and between mercury concentrations in higher trophic species and their prey items.
Environmental mercury has increased due to anthropogenic causes
Percent of sites in Louisiana that have mercury advisories that include each group of fish. Total sites listed = 16. Top predators tend to be listed more often.
Mercury Toxicity • Influenced by the form of mercury, environmental media, environmental conditions, the sensitivity or tolerance of the organism, and the life history stage. • Toxic effects occur because mercury binds to proteins and alters protein production or synthesis. • Effects include reproductive impairment, growth inhibition, developmental abnormalities, and altered behavioral responses • Can affect the nervous system (coordination, sense of touch, taste, and sight • Particularly damaging to developing embryos
Environmental PCB’s • Polychlorinated biphenyl’s – a group of highly toxic chlorinated industrial chemicals used as dielectrics, coolants and lubricants in transformers and other electrical equipment, weatherproofers, and to prolong residual activity of pesticides. • Usually released to the environment as a mixture with other chemicals • Fire resistant, low volatility, relatively stable and persistent = good for industry, bad for environment.
Environmental PCB’s • Had been used for about 25 years until PCB poisoning of birds and people were noticed in 1966. • By the late 1970’s, evidence of extreme persistence and adverse health effects had resulted in a ban on their manufacture in some industrialized countries. • PCB’s are carcinogenic, can cause an increase in bacterial infections, liver lesions, and genetic defects.
Bioaccumulation • PCB’s are not soluble in water, but are soluble in fat. • Therefore, they tend to bioaccumulate and biomagnify. • Can increase as much as a 1,000-fold as they move up the food chain/
Environmental Effects • Seals and porpoises • Induced reproductive impairment • Minks • Embryo toxicity • Birds • Eggshell thinning • Turtles (red-eared slider) • Hormone disrupting effects with sex determination
Hudson River and PCB’s • Between 1947 and 1977, General Electric dumped an estimated 1.3 million pounds of PCB’s into the Hudson River. • Source’s were two capacitor manufacturing plants • PCB’s are now found in the Hudson Rivers sediments and wildlife. • One study showed that breast milk taken from women around the Hudson River was seven times the amount permitted in cow’s milk. • Commercial fishing was shut down because of PCB concentration found in the fish.
Hudson River Clean-up • We can do nothing, and new sediment will eventually bury the PCB’s. • Overtime, PCB levels in the wildlife will decline • This is the approach being taken on Lake Hartwell, SC • We can dredge out the contaminated soil. • Physically remove the contaminated sediment and haul somewhere else • Who wants that shipment? • Two opposing sides for dredging the Hudson River.
Those That Say No to Dredging • Mostly it’s the officials for G.E. saying dredging would not be good. • The five year project would devastate this ecosystem • “It’s almost like clear-cutting a forest.” Adam Ayers, GE Biologist • PCB’s would be ‘resuspended’ • Could take 20 years for the fishery to recover • Many people do not want the waste to be put near their home
Those That Say Yes To Dredging • EPA and private citizen groups • Permanent removal of PCB’s is good • Acknowledge that citizens along the river will be disturbed while the dredging occurs • Will lessen the spread of PCB’s throughout the Hudson • Environmental dredging techniques work like a vacuum, and minimize the amount of resuspension
Love Canal • William T. Love decided he wanted to build a 7 mile canal approximately 4 miles upstream of Niagara Falls to generate electricity and allow ships to bypass the falls. • However, only a mile of the canal was dug when he had to abandon this project.
Overview of the Canal area. The canal is marked by the arrow.The northern branch of the Niagara River and Grand Island, New York, are visible at the bottom of the photo. North is at top.
Love Canal • By 1920, Love’s land was sold at public auction and became a municipal and chemical disposal site. • From 1942 – 1953 the Love Canal Landfill was used principally by Hooker Chemical, one of the many chemical plants located along the Niagara River. • Nearly 21,000 tons of ‘toxic chemicals’ were dumped at the site • In 1953, the landfill was filled to capacity and Hooker covered it with layers of dirt. • The Niagara Board of Education then purchased the land for one dollar.
Love Canal • When Hooker sold the land, it gave a warning as to what chemicals were buried on site. • The area then became a housing development. • Homeowners were not told of the potential hazards • An elementary school was actually built directly on the former landfill • From the late 1950’s to the early 1970’s residents submitted repeated complaints of odors and ‘substances’ surfacing in their yards. • City officials assisted by covering the ‘substances’ with dirt or clay • Including those found on the playground at the 99th Street School
Love Canal • By 1978, the Love Canal neighborhood included 800 private, single-family homes, 240 low-income apartments, and the 99th Street Elementary School. • April 1978, a reporter wrote a series of articles on hazardous waste problems in the Niagara Falls area, including the Love Canal area • Residents were beginning to question health risks and noting already existing inexplicable health problems. • Children and animals were experiencing chemical burns from playing with dirt. • Birth defects, miscarriages, low birth-weight, cancers and respiratory disorders were found here