Download
1 / 40
400 likes | 427 Vues
Discover the impact of Pupil Premium on improving disadvantaged learners' outcomes, explore evidence-based strategies, and effective teaching tools. Uncover the intricate link between resources, learning outcomes, and social mobility. Learn about Hattie’s Visible Learning meta-analysis and practical toolkits for educators.

E N D
Improving learning for disadvantaged learners and the pupil premium Professor Steve Higgins Durham University s.e.higgins@durham.ac.uk
Outline • What is the Pupil Premium? • Resources and learning • Research evidence and a ‘Toolkit’ for teachers • Evidence from Hattie’s Visible Learning • Activities and feedback Intro
The pupil premium • Aims: • to reduce the attainment gap between the highest and lowest achieving pupils nationally • to increase social mobility • to enable more pupils from disadvantaged backgrounds to get to the top Universities • to provide additionalresource to schools to do this • Estimates of £430/ pupil on fsm The Pupil Premium
£430 per pupil – a lot or a little? The Pupil Premium
Issues • Real money or plugging the gap? • Raising attainment (test scores) or aspirations (continuing/succeeding in education) • Assessment, attainment, aspirations – an impossible triangle? Assessment Attainment Aspirations The Pupil Premium
Resources and learning • Above a minimum threshold – no simple link • More money ≠ more learning • There is an association but it’s weak and complex • Conclusion: spending more won’t guarantee improvement - no simple solution Resources
The Bananarama Principle • For resources It ain’t what you do it’s the way that you do it… • So how do you spend £430/pupil to “get results”? • Or what does the evidence say is a good investment or a poor investment for learning? Resources
Government advice • Schools should decide • Perhaps • Smaller classes • One-to-one tuition Resources
Smaller classes? • Complex evidence- no clear link with class size and achievement • Experimental trials suggest • Classes need to be less than 17 • And teachers need to change the way they teach • But teaching assistants NOT as effective • The maths: • £430 x 20 pupils x 3 classes = £25,800 • 70%+ on fsm = 1 extra teacher per 3 classes • Class size reduction from 30 to 23 Toolkit
One to one tuition • Highly effective • I hour/ day over at least 6 weeks • Support for class teacher to re-integrate • The maths… • 6 weeks x 5 days x 1 hour = 30 hours • 4 days teacher time • Approx £800 • May work if you use pairs and target pupils only need it once a year… Toolkit
So what does and does not work? • Evidence from meta-analysis – comparing impact cumulatively and between different approaches • Offers “good bets” – not solutions • Accumulation of evidence over 20 years or more Toolkit
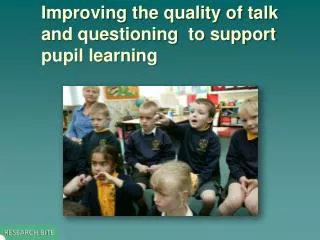
Thoughts on the toolkit • Technical • Presentation, clarity, level of detail etc • Content Toolkit
What do you think? Task 1 • In small groups, read the statements and decide which you think would be most effective at improving learning (to go at the top) and the least effective (at the bottom) • Arrange the remaining statements in a diamond format on the grid in order of effectiveness. Activity 1
Feedback Activity 1
Hattie’s ‘Visible Learning’ and the research evidence base ‘Visible Learning’ Visible Learning
Meta-analysis • Designed to combine quantitative findings from similar studies • Converts sample differences into a common metric – effect size • Invented in psychology and education, developed in medical reviewing • Relatively uncontroversial as a research synthesis tool to combine findings from similar studies Visible Learning
Examples of Effect Sizes: “Equivalent to the difference in heights between 15 and 16 year old girls” ES = 0.2 58% ofcontrol group below mean of experimental group Probability you could guess which group a person was in = 0.54 Change in the proportion above a given threshold: from 50% to 58% or from 75% to 81% Visible Learning
“Equivalent to the difference in heights between 13 and 18 year old girls” ES = 0.8 79% ofcontrol group below mean of experimental group Probability you could guess which group a person was in = 0.66 Change in the proportion above a given threshold: from 50% to 79% or from 75% to 93% Visible Learning
Hattie’s meta-analysis • ‘Super-synthesis’ • Aggregates meta-analyses • Identifies an overall distribution of effects • Draws inferences from the relative differences in average effects from different areas of education research • Distinctly controversial as a synthesis technique for comparing different research findings • Aimed to identify major influences on achievement (based on over 700 meta-analyses) • And to develop an assessment and feedback model based on these influences Visible Learning
So what raises attainment….? Synthesis of evidence from • 750+ meta-analysis • 50,000 studies, and • 200+ million students Visible Learning
Rank these 11 effects: Homework Acceleration of gifted students Retention (holding back a year) Ability grouping Reducing disruptive behavior in class Individualized instruction Reading Recovery Feedback Integrated curriculum programs Open vs. traditional classes Changing schools (from 1 = highest effect to 11 = lowest effect) Visible Learning
Rank these 11 effects: Answers Reducing disruptive behavior in the class .86 Feedback .72 Acceleration of gifted students .60 Reading Recovery .50 Integrated curriculum programs .40 Homework .30 Individualized instruction .20 Ability grouping .10 Open vs. traditional classes .00 Retention (holding back a year) -.16 Changing schools -.34 Visible Learning
Various Influences Visible Learning
Percentage of Achievement Variance Teachers Students Home Peers Schools Principal Identifying what matters Visible Learning
Teacher provides the best ‘leverage’ in the system Implications for the teacher’s role in learning from this dataset Central importance of feedback to learners and to the teacher (formative feedback) Active role for the teacher Importance of pedagogy (the ‘how’ rather than the ‘what’) Assessment and feedback tools to support teachers in moving students on Implications for pedagogy Visible Learning
Teachers • Clear learning intentions • Challenging success criteria • Range of learning strategies • Know when students are not progressing • Providing feedback • Actively learn themselves Visible Learning
Students … • Understand learning intentions • Are challenged by success criteria • Develop a range of learning strategies • Know when they are not progressing • Seek feedback • Actively teach themselves Visible Learning
Activator or Facilitator ? • Facilitator • Simulations and gaming • Individualised learning • Whole language approaches • Inductive teaching • Web-based learning • Inquiry based learning • Smaller classes • Activator • Reciprocal teaching • Feedback • Teaching students self-verbalisation • Meta-cognition • Direct instruction • Mastery learning • Challenging goals Visible Learning
Activator or Facilitator ? Visible Learning
Teaching or Working Conditions? Visible Learning
An emphasis on learning strategies NS NE ES Creativity Programs 658 814 .70 Teaching student self-verbalization 92 1061 .67 Meta-cognition strategies 43 123 .67 Problem solving teaching 221 719 .61 Study skills 656 2446 .59 Concept mapping 91 105 .52 Motivation for learning 322 979 .48 Visible Learning
Summary of effect-sizes relating to types of feedback(adapted from Kluger&DeNisi, 1996) Feedback It’s correct 114 .43 It’s incorrect 197 .25 FB about changes fromYes 50 .55 previous attempts No 380 .28 FB designedYes 49 -.14 to discourage the student No 388 .33 Praise FB Yes 80 .09 No 358 .34 Frequency of FB Lots 97 .32 Little 171 .39 Goal setting Difficult goals 37 .51 Easy, ‘do your best’ goals 373 .30 Visible Learning
Conclusions • Provide correct feedback .43 • About previous attempts .55 • Related to more difficult goals .51 • That does not discourage… .33 • ...or threaten their self-esteem .47
What do you think? Task 2a • Work in groups • Brainstorm ideas to improve learning in your school – one per post-it note, from the small and practical to the ambitious, creative and visionary! • Try and get as many different ideas as you can – 5 mins
What do you think? Task 2b High impact on learning Meta-cognitive approaches One-to-one tutoring High cost £ Low cost £££££ Reducing class sizes Learning styles Low impact on learning
Decide whether you think your ideas are likely to be high impact or low impact on learning • Decide whether you think they will be high cost or low cost • Adjust the positions as you add more ideas
What do you think? Part 2 High impact on learning Meta-cognitive approaches One-to-one tutoring High cost £ Low cost £££££ Reducing class sizes Learning styles Low impact on learning
Conclusions • Money and resources on their own won’t make a difference • Improving attainment and aspirations is extremely challenging with high stakes assessment • Remember the Bananarama principle – “it ain’t what you do, it’s the way that you do it – that’s what gets results” • Invest in professional development to improve feedback and classroom learning