Download
1 / 25
350 likes | 885 Vues
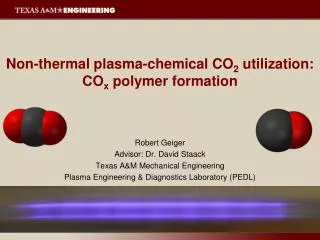
Non-thermal plasma-chemical CO 2 utilization: CO x polymer formation. Robert Geiger Advisor: Dr. David Staack Texas A&M Mechanical Engineering Plasma Engineering & Diagnostics Laboratory (PEDL). Outline. Introduction Background History Industrial Prospects Non-Thermal Plasma

E N D
Non-thermal plasma-chemical CO2 utilization: COx polymer formation Robert Geiger Advisor: Dr. David Staack Texas A&M Mechanical Engineering Plasma Engineering & Diagnostics Laboratory (PEDL)
Outline • Introduction • Background • History • Industrial Prospects • Non-Thermal Plasma • Objectives • Thermodynamic and Kinetic Analysis • Thermodynamic Properties • Thermodynamic Equilibrium of Carbon Oxides • Kinetics • Experimental Setup and Results • DBD Reactor and Setup • Plasma Parameters and Optical Emission Spectroscopy • Overall Kinetics • Characterization of Products • Conclusions
Hydrocarbon Utilization CO2 Plasma Dissociation H=393.5 kJ/mol CO2 H=241 kJ/mol H2O CO H2O Combustion • Combustion • Fischer Tropsch • Ethanol • Hydrogen CO H2 CH4 (CxHy) Partial Combustion H=110 kJ/mol CO2 1/2 Plasma Polymerization Upgrading Carbon Oxide Polymers Higher Hydrocarbons Petrochemicals (Matthias Ballauff, et. al Angew. Chem. Int. Ed. 2004, 43)
Carbon Monoxide at Really High Pressures V V Brazhkin 2006 J. Phys.: Condens. Matter 18 9643 Lipp M J et al 2005 Nat. Mater.4 211
Carbon Oxides ? • CO • CO2 • C3O2 Carbon Suboxide (Matthias Ballauff, et. al Angew. Chem. Int. Ed. 2004, 43)
Thermodynamic Equilibrium CO CO2, C3O2 (g) Case 1: CO CO2, C3O2 (g), (C3O2)n (s), C(gr) CO CO2, C3O2 (g), (C3O2)n (s) Case 2: Case 3:
Kinetics Proposed mechanism from several sources McTaggart FK PIasma Chemistry in Electrical Discharges (1967)
Kinetics • Pathway for C3O2 polymer formation • C + CO + m C2O + m k1 = 1.5 * 10-31 [cm6/molecule2*s] • C2O + CO C3O2 k2 = 4.33 * 10-15[cm3/molecule*s] • n(C3O2) (C3O2)n k3 = 6.6 * 10-14 [cm3/molecule*s] • Pathway for C(gr) formation • C + C C2 k4 = 2.16 * 10-11[cm3/molecule*s] • C2 C(gr) • The pathway of C3O2 formation should be faster than the pathway to solid carbon formation • C3O2 Monomer and Polymer formation are more favorable at low temperaturesand high pressures • C3O2 should formation favor low [C]/[CO]
Kinetic Model in Development Still need to add • CO* reactions • C(s) reactions • Surface reactions
Kinetic Model in Development • Const T • Te = 1 eV • ne = 1013 cm-3 • ne = const CO C3O2 CO2 C3O2(p)
Experimental Setup • Power Supply: • Vmax ~ 10 kV • Imax ~ 40 mA • Freq ~ 25 – 30 kHz • P ~ 40W-150W
DBD Reactor Color Variations
Increasing FlowFlow appears to change power density distribution 1700 sccm 870 sccm 180 sccm Gas temperature and surface temperature do not cause the different film colors. Increasing Power Power increases deposition rate and film darkness ~ 30W ~50W ~100W
FTIR – Comparison with High Pressure Film (High Pressure Film FTIR data taken from: Lipp M J et al 2005 Nat. Mater. 4 211)
Film Properties Hydration • C:O ~ 1.5 - 3.5 (XPS) • Solubility • Water (Hydrates) • Insoluble • Acetone • Ethanol • Solubility allows for spin coating and layer by layer film growth Before After C:O ~ 1.9 1.7
Emission Spectroscopy Herzberg CO Bands (C1Σ+ – A1π) Angstrom CO Bands (B1Σ+ – A1π) C2 Swan Bands (d3π– a3π)
Future Work • Determine the polymer structures (NMR) and chain length • Characterize polymers and determine their properties • Complete the kinetic model and compare with experimental • Determine optimum production parameters
Conclusion • CO Plasma • Interesting films can be formed as fast as 1 mg/min at 50W with solely carbon and oxygen atoms • These films appear similar in structure to high pressure CO polymers not C3O2 • Increased power darkens the film and increases deposition rate • Color changes do not alter the FTIR • A kinetic model in under development • The C2 swan, CO angstrom and CO Herzberg bands enables temperature measurements in the visible range • CO2 Plasma • Micro-glow discharge showed best results • High power density and rapid quenching are thought to be desirable
References • Lipp M J et al 2005 Nat. Mater.4 211 • V V Brazhkin 2006 J. Phys.: Condens. Matter 18 9643 • McTaggart FK PIasma Chemistry in Electrical Discharges (1967) • P.C.Cosby, J. Chem. Phys. 98,9560(1993). • K.M.D’Amico,and A.L.S.Smith, J.Phys.D: Appl. Phys. 10,261 (1977) Questions? Email: rpg32@tamu.edu