Download
1 / 30
300 likes | 399 Vues
Explore the impacts of increased pollution on hailstorms using advanced modeling simulations and insightful analysis. Investigate the influence of cloud base temperature and CCN concentrations on hail characteristics and precipitation patterns.

E N D
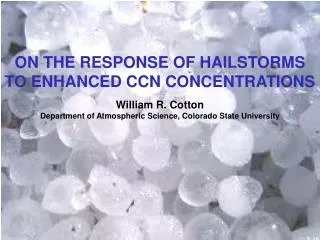
ON THE RESPONSE OF HAILSTORMS • TO ENHANCED CCN CONCENTRATIONS • William R. Cotton • Department of Atmospheric Science, Colorado State University
Approaches to hailstorm simulation • 2 moment bulk microphysics • Hybrid approach: Bulk 1-M or 2-M microphysics with bin representation of hail • Full bin storm model • 3 moment bulk model
Bin approach • The full bin approach is the most realistic approach but is very computationally expensive and has only been done for hailstorms in two dimensions
Previous studies of CCN impacts on hail • To date, only two studies have examined the impacts of increasing CCN on hail (for same storm) with contrasting results • Noppel et al. (2010):used 2M microphysics in 3D storms and found more numerous but smaller hailstones, reduction in hail amounts reaching surface for greater CCN concentrations • Khain et al. (2011): used a full bin microphysics but in 2D and found an increase in total hail mass and sizes of hailstones, larger hail reaches surface for greater CCN amounts • Both these studies were for the same storm
Adrian Loftus developed a 3-moment hail model in RAMS • Most bulk models are either 1-moment(predict on mass), or 2-moment(predict on mass and concentration) or a few are 3-moment(predict on mass, concentration, and the 6th moment which is proportional to radar reflectivity) • The 3-moment scheme is still computationally less demanding than a bin model but allows representation of the tail of the distribution where hail stones reside
Brief model description RAMS v.6 with bin-emulating two-moment microphysics (Saleeby & Cotton, 2004, 2008). processes are weighted by dist’s function of Nx and Qx For this study we added a triple-moment hail microphysics scheme (Loftus, 2012) that predicts of 6th and 0th moments so all three parameters of the distribution are variable: Nh, Qh, andnh
3M vs 2M • Predicting 6th, 3rd, and 0th moments of hail size spectrum allows all three gamma distribution parameters to vary freely- removes need to ‘tune’ parameters • Variable nh improves realism in evolution of hail distribution during sedimentation and melting • broadening/narrowing aloft, narrowing at low levels • mitigates artificial shifts towards large hail sizes
Hail reports < 1 in 1 in 1.75 in Adrian performed simulations for an actual case: • 29 June 2000 STEPS supercell Goodland, KS WSR-88D loop of lowest level radar reflectivity 2025 to 0410 UTC F1 tornado
Triple-moment hail microphysics Largest hail at surface following right turn Largest hail collocated with largest Ze values Left: Swath of column maximum reflectivity from KGLD radar. Surface fallout locations for hail ≥ 3 cm computed using particle growth model for 29 June 2000 supercell are overlaid (black dots) [from Tessendorf et al. 2005] Right: Swath of column maximum equivalent reflectivity factor (Ze) [dBZ] with contours of surface hail concentrations [1x10⁻⁴, 0.01 m-3] having diameters ≥ 2 (blue), 3 (black) and 4 cm (purple) for simulation using 3MHAIL scheme. Times (min) of maximum Ze also shown.
Gustavo Carrio and I then exercised Adrian’s model A rather large number of hailstorm simulations were carried out varying both [CCN] and cloud base temperature.
RAMS was set up as follows: 3-D domain: 100 X 100 X18 Km (Nx=Ny=200) Dx = Dy = 500m , Dt = 1s 1st level 40m, Dz stretching up to 500m Hot Bubble (2.5K), 30km upwind of the center
Benchmark case Marginally severe single cell ordinary thunderstorm Occurred over central Tennessee on 15 May 2009 2.5 cm diameter hail stones CAPE = ~ 1500 J kg-1
Sensitivity experiments [CCN]: 16 values between 150 and 2400 cm-3 constant at low levels, exponentially decreasing above 3km. Cloud base: The sounding of the case study was systematically perturbed by varying low-level vapor contents from -12 to 12% (10 levels, ~ 500m).
Sensitivity experiments Green arrow denotes the profiles of May 15 2009 Blue arrow represents the simulations with the lowest [CCN] (150cm-3, “clean”). In the following figures each point is a quantity that characterizes a run. To isolate the dependence on [CCN] many figures show values normalized by each corresponding “clean” case (along the blue arrow).
Precipitation Preliminary results For storms with higher cloud bases, significant CCN impact on: both total precipitation and hail fraction For lower cloud bases →little impact
Hail integral mass and rates Preliminary results Large positive changes in both the integral mass of hail precipitation and maximum rates for runs with higher cloud bases.
Hail concen and predominant size Preliminary results Large positive changes for N’s for runs with higher cloud bases. Positive although more modest impact on predominant diameters.
Peak updrafts and SCLW Wmax Peak SCLW Positive relative changes for storms with higher cloud bases. Linked to the availability of supercooled liquid water.
Change in storm “size” Increasing [CCN] tends to concentrate hail in smaller areas for the dries cases. Larger accumulations concentrate in smaller areas of precipitation (as in Carrió & Cotton, 2011).
Downdrafts CCN → downdraft area ↑ for runs with lower cloud bases.
Downdrafts CCN → downdraft area ↑ for runs with lower cloud bases. Larger impact occurs for run with higher rain fraction of precipitation
Summary: • We find significant sensitivity to CCN concentrations for storms with colder cloud base temperatures or higher cloud bases and with smaller distances between cloud base and freezing level(D) • For this regime we find larger predominant hail sizes and concentrations, greater integral masses of hail, and greater hail precipitation
For warmer cloud base temperatures and greater D • The response to varying CCN amounts is weak • Warm rain processes are much more active