Download
1 / 33
390 likes | 680 Vues
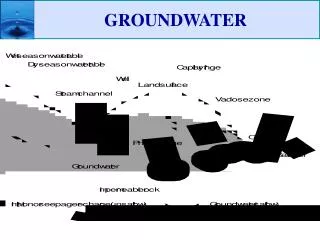
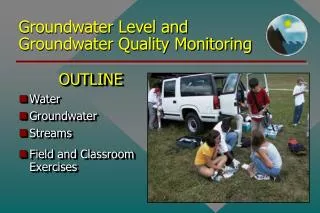
Groundwater Level and Groundwater Quality Monitoring. OUTLINE Water Groundwater Streams Field and Classroom Exercises. Hydrologic Cycle. Cycling of water between ocean atmospheric and land reservoirs Responsible for distribution of water in land reservoirs. ppt = precipitation

E N D
Groundwater Level and Groundwater Quality Monitoring OUTLINE • Water • Groundwater • Streams • Field and Classroom Exercises
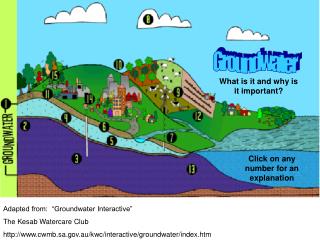
Hydrologic Cycle • Cycling of water between ocean atmospheric and land reservoirs • Responsible for distribution of water in land reservoirs ppt = precipitation E = evaporation ET = evapotranspiration Q= overland stream flow gw= groundwater flow
Why Water • water availability / supply • temporal and spatial distribution • water quality • quality of water as it moves between reservoirs - natural and anthropogenic impact • water management • management is a function of understanding our water needs within a fixed supply
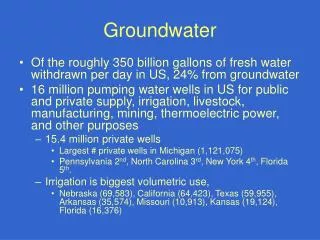
Water as a Resource • Available as surface water – streams, lakes and groundwater • Water is used for human consumption, irrigation of crops, industrial applications, and other uses • Protecting water as a resource requires monitoring for availability and quality
Water Availability & Quality • Availability • Natural and artificial recharge • Quality • Natural vs. impacted
Watersheds and CSOs Williams Creek Crooked Creek Pogue’s Run Pleasant Run
White RiverFloodplain • Monitoring Program • river discharge • groundwater levels • groundwater and river water quality
Mean Annual Discharge of the White River South of Indianapolis Centerton Gauging Station Data from USGS, 2000
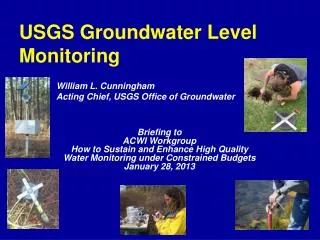
Groundwater Monitoring • Water level measurements • Determined from wells and piezometers • Measurements include water table level and water pressure • Used to determine groundwater flow
Monitoring Well and Piezometer Construction • Monitoring wells consist of 2” PVC riser fitted with 40 slot screen • Installed using Drill rig and manually • Piezometers consist of 1/4” EMT • Installed manually
Groundwater Monitoring • Wells near the river are in close hydrologic connection to the river
Groundwater Monitoring • Wells farther from the river are hydrologically not as closely connected to the fluctuations of the river and show more variability in the water elevations at any single sampling date.
Water Quality Monitoring • Document water quality parameters for a water body • Determined suitability of water for a variety of uses • human use • ecosystem health • Determine type and magnitude of impact to water source
Water Quality Monitoring • Physical parameters • Temperature • pH • Dissolved oxygen • Nitrates • Phosphates
Temperature • Determines suitability of water for human and other use • Important aquatic organism survival • Changes in water temperature • Seasonal/climatic control • Discharge of groundwater • Removal of streamside vegetation • Discharge of municipal and industrial wastewater
Guide for Water Quality Ranges Temperature Change (degrees centigrade) 0-2 Excellent 2.2-5.0 Good 5.1-9.9 Fair > 10.0 Poor
pH • A measure of how acidic or basic water is • Controls many chemical and biochemical processes in water • Changes water pH • Geology of rocks and soils • CO2 production and use • Acid rain, municipal and industrial discharges
Guide for Water Quality Ranges pH (units) 6.5-7.5 Excellent 6.0-6.4, 7.6-8.0 Good 5.5-5.9, 8.1-8.5 Fair <5.5, >8.6 Poor
Dissolved Oxygen • Measure of the amount of dissolved in water • Important for growth and survival of aquatic organism • Changes in dissolve oxygen content of water • Seasonal temperature • photosynthesis and respiration by aquatic organisms • Microbial decay of organic carbon from municipal, industrial and agricultural wastewater
16 14 60° 12 10 40° 8 20° 6 D N A J O J S A M M F J Dissolved Oxygen • Relationship between temperature vs. dissolved oxygen T T T T T T T T T o o T o DO Temp T o o T o o o o o o o Month
Guide for Water Quality Ranges Dissolved oxygen (% saturation) 91-110 Excellent 71-90, >110 Good 51-70 Fair <50 Poor
Nitrates • Form of nitrogen that is an essential plant nutrient • High concentration in water • causes eutrophication in surface • Make water unfit for human consumption • Changes in nitrate content in water • Cycling by vegetation • Discharge of municipal and industrial wastewater • Runoff from fertilized lawns and farmland, animal feed lots, manure storage areas and failing septic systems
Guide for Water Quality Ranges Nitrate Nitrogen (mg/l) <0.3 Excellent 0.4-0.8 Good 0.9-1.9 Fair > 2.0 Poor
Phosphates • Essential nutrient for plants and animals • Excess phosphate in surface water can cause accelerated algal growth and eutrophication • Changes in phosphate content in water • Sediment/soil erosion • Discharge of municipal and industrial wastewater • Runoff from fertilized lawns and farmland, animal feed lots, manure storage areas and failing septic systems
Guide for Water Quality Ranges Total Phosphates (mg/l) <0.10 Excellent 0.11-0.16 Good 0.17-0.58 Fair 0.59-2.99 Poor <3.0 very poor