Download
1 / 30
360 likes | 579 Vues
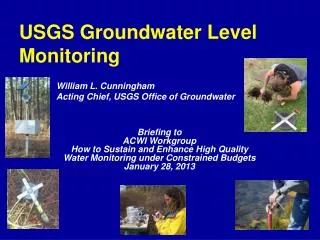
USGS Groundwater Level Monitoring. Briefing to ACWI Workgroup How to Sustain and Enhance High Quality Water Monitoring under Constrained Budgets January 28, 2013. William L. Cunningham Acting Chief, USGS Office of Groundwater. Monitoring Networks Outline.

E N D
USGS Groundwater Level Monitoring Briefing to ACWI Workgroup How to Sustain and Enhance High Quality Water Monitoring under Constrained Budgets January 28, 2013 William L. Cunningham Acting Chief, USGS Office of Groundwater
Monitoring Networks Outline • Background: Relevant GW Concepts • Existing Network • Proposed Network • Supporting Infrastructure • DCPs and Telemetry • Quality Assurance • Standards and Procedures • Training
Why Measure Water Levels? Groundwater Provides • About half of the Nation’s drinking water • About 40% of the Nation’s Public Supply • ~100% of “self supplied” water • 50 BGD for agriculture • Some to nearly all of streamflow
“Non-Standard” Measurements Radar http://www.youtube.com/watch?v=3IV1xVLIVM0 Microgravity Sonic
Storage: SW vs GW Surface Water Storage Groundwater Storage Denver Basin Aquifer System • Lake Mead: 9.3 trillion gallons Paschke and others, 2011 Anderson and Woosley, 2005 Bureau of Reclamation
Thinking in 3 Dimensions:NACP Aquifer System GW level monitoring must account for layered aquifers In many systems, water-level change within an aquifer also is important, and should be monitored.
North Atlantic Coastal Plain Aquifer SystemAreal Distribution of Wells Hypothetical example of 2-D coverage, Coastal Plain groundwater monitoring network Coastal Plain is blanketed with wells Example: Wells along section A-A’ providing good coverage for the State
North Atlantic Coastal Plain Aquifer SystemWell Distribution in Cross Section • Wells provide good coverage of the Potomac aquifer • Surficial aqufierunmonitored • Chesapeake aquifer unmonitored • Castle Hayne-Aquia aquifer unmonitored • Severn-Magothy aquifer unmonitored
Program FocusGWRP, CWP, and NSIP • Approximately $8M in “long term” GW level data collection in FY12 • Much smaller than streamgaging expenditures: order of magnitude + • Different focus of our respective Programs • Cooperator Choice • USGS Choice • Science
Annual Well CountWells with at least one measurement in NWIS
Wells with Discrete Measurements Decrease due to loss of state partners Increase due to increase in furnished record Fluctuations due to furnished record
Instrumented Wells Real Time and Non Real Time Most continuous wells are not furnished record Increased demand from cooperators in daily value/real time data Also reflects relative cost reduction of continuous record
2013: Frequency of Measurement Furnished record often Annual or Biannual measurements >20K wells; about 7,500 quarterly or more frequently
Existing “Networks”: “Active” Wells • Data must be in NWISWeb • At least one measurement or site visit within last 13 months • Any site, at any frequency
Existing Networks: Climate Response • Open to a single, known hydrogeologic unit • Known well construction • Located in unconfined aquifers or near-surface confined aquifers that respond to climatic fluctuations • Minimally affected by pumpage and likely to remain so • Essentially unaffected by irrigation, canals, and other potential sources of artificial recharge • Long-term accessibility • Well has never gone dry (not susceptible to going dry)
Existing Networks: Springs • Spring reflects concentrated discharge of groundwater at the land surface. • Integrates hydrogeologic processes over large areas, and provides information about groundwater conditions as well as aquifer characteristics.
(Cunningham and others, 2007) Climate Response Network • ; • At least one well within each of the 366 National Weather Service climate divisions • Covers about 170 now • Network design includes • real-time, continuous data collection to enable improved drought management; • long-term records that provide a statistical framework for evaluating trends in our Nation’s ground-water resources; • adequate areal coverage of our Nation’s principal aquifers and recharge areas to these aquifers. SECURE Act: ....the Secretary shall....(B) by expanding the network of monitoring wells to reach each climate division, support the groundwater climate response network to improve the understanding of the effects of global climate change on groundwater recharge and availability
A National GW Monitoring Network Federal-State-Tribal collaboration USGS GW Levels and Quality Data available through common portal Data: guidance provided, but caveat emptor
Supporting InfrastructureDCP’s and Telemetry 10 years ago ~600 13 years ago, ~300
Quality AssuranceStandards and Procedures • Office of Groundwater Technical Memoranda • Water Mission Area Policy Memos • Survey Manual • TWRI’s and T&M’s • Annual Report Guide • NWIS Users Guides • Individual Office Policies • Office Quality Assurance Plan
Quality Assurance Example: Tape Calibration OGW policy requires tape calibration annually
14 Tapes from 6 Vendors measured at manufacturer’s reference tension. Most tapes do not meet 0.01 ft accuracy at stated pull force.
Quality AssuranceWater Level Training • GW Field Techniques Class • GW Data Processing Class(es) • Annual Workshops • Field methods, data processing, handheld data collection/entry…….. • Electronic Troubleshooting