Download
1 / 20
200 likes | 304 Vues
Explore DNA sequence variation in ecology and evolution, focusing on clustering methods and phylogenetic reconstruction. Learn about distance methods, multivariate analysis, and character alignment techniques. Understand how to hypothesize homology relationships and interpret BLAST search results. Dive into models of DNA substitution and distance criteria for various data types. Discover phylogenetically informative sites and explore network representations for reticulate evolution. Practice multivariate clustering and eigenanalysis for advanced data interpretation.

E N D
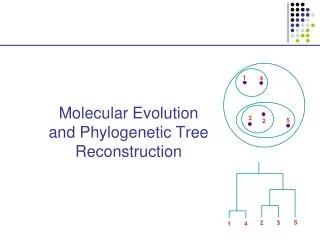
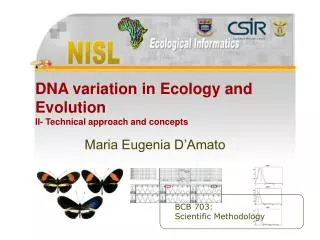
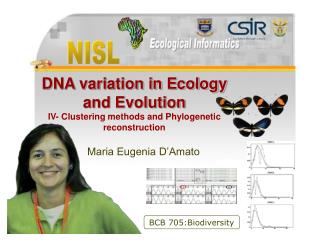
DNA variation in Ecology and EvolutionIV- Clustering methods and Phylogenetic reconstruction Maria Eugenia D’Amato BCB 705:Biodiversity
Organization of the presentation Distance ML MP • Phylogenetic reconstruction • Networks • Multivariate analysis
Characters:independent homologous • Continuous • Discrete Binary Multistate
DNA sequence characters Alignment = hypothesizing of a homology relationship for each site Sequence comparison BLAST search - GenBank Coding sequenceblastn blastx Non-coding DNA blastn
Blast search results Score E Sequences producing significant alignments:(Bits) Value gi|87299397|dbj|AB239568.1| Mantella baroni mitochondrial ND5...101 3e-18 gi|343991|dbj|D10368.1|FRGMTURF2 Rana catesbeiana mitochondri...97.6 5e-17 gi|14209845|gb|AF314017.1|AF314017 Rana sylvatica NADH dehydr... 93.7 8e-16 The lower the E-value, the better the alignment GeneBank Accession numbers for the sequence Species that match the query
Blast search results >gi|87299397|dbj|AB239568.1| Mantella baroni mitochondrial ND5, ND1, ND2 genes for NADH dehydrogenase subunit 5, NADH dehydrogenase subunit 1, NADH dehydrogenase subunit 2, complete cds Length=10814 Score = 101 bits (51), Expect = 3e-18 Identities = 99/115 (86%), Gaps = 0/115 (0%) Strand=Plus/Minus Query 451 TTAGTTGAGGATTAAATTTTAGGATAATAACTATTCAGCCGAGGTGGCTGATGGAAGAAA 510 ||||||||||||||||||||| ||||||| ||||||||| ||||| | |||||||| | Sbjct 10203 TTAGTTGAGGATTAAATTTTAAAATAATAAGTATTCAGCCCAGGTGACCAATGGAAGAGA 10144 Query 511 AAGCTAAAATTTTACGTAGTTGTGTTTGGCTAATGCCGCCTCATCCGCCTACAAG 565 | |||| ||||||||||||||| |||||| |||| || ||||| || |||||||| Sbjct 10143 AGGCTATAATTTTACGTAGTTGAGTTTGGTTAATACCCCCTCAACCTCCTACAAG 10089 Description of the genes contained in the sequence with this Accession number Strands aligned 5’end alignment
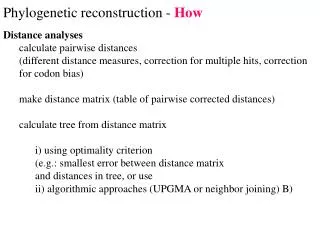
Phylogenetic reconstructionDistance methods C1 C2 C3 C4 C5 C6 C7 1 2 3 4 5 5 X 7 Distance criterion 5 x 5 Similarity / dissimilarity criterion dendrogram
Distances criterion for binary data a a + b + c a = bands common to a and b b = bands exclusive to a c = bands exclusive to b J = Jaccard’s distance P1 (x2, y2) Manhattan distance M = Euclidean distance (x1-x2) 2 + (x2-y2) 2 P2 (x1, y1)
Distance criterion for DNA data-Models of DNA susbstitution fAA fAC fAG fAT fCA fCC fCG fCT fGA fGC fGG fGT fTA fTC fTG fTT Fxy = a b c d e f g h i j k l m n o p Fxy = p = n of different nucleotides/ total n nucleotides
Models of DNA susbstitution 1 1-2P-Q 1 ln 1 4 1-2Q 1 ln 2 + dxy = D = 1 – ( a + f + k + p) Equal rate Jukes and Cantor dxy = - ¾ ln (1- 4/3 D) B = 1 – ( 2A + 2C + 2G + 2T) F81 Unequal base freqs dxy = - B ln (1- D/B) P = c + h + i + nTransitions Q = b + d + e + g + j + l + m + oTransversions K2P
Distances criterion for diploid data I Nei 1972 Jx = xi2 Jx = yi2 Jxy = xiyi Dn -ln Jxiyi JxiJyi = Cavalli Sforza 1967 Darc = (1/L) (2/)2 = cos-1xiyi
Phylogenetic reconstruction criterion for distance data Ultrametric tree (UPGMA) Additive tree (NJ) A C A V1 V1 V4 B V3 V3 V2 V2 V5 D V4 C B Properties Properties dAB = v1 + v2 dAC = v1 + v3 + v4 dAD = v1 + v3 + v5 dBC = v2 + v3 + v5 dCD = v4 + v5 dAB = v1 + v2 + v3 dAC = v1 + v2+ v4 dBC = v3 + v4 v3 = v4 v1 = v2 + v3 = v2 = v4
Maximum Likelihood 3 1 2 4 1 2 3 4 C C C A A A G G G C C C 5 + Prob……. A + Prob Lj = Prob C A A 6 LD = Pr (DH) Tree after rooting at an internal node Unrooted tree 1 J n • C….GGACACGTTTA….C • C….AGACACCTCTA….C • C….GGATAAGTTAA….C • C….GGATAGCCTAG….C L = L1 x L2 x L3…x LN. = Lj LnL = ln L1+ ln L2 + …. LN = ln Lj
Hypothesis testingLikelihood ratio test Rate variation = log L1 – log L0 Appropriate substitution Model 22 distribution d.f. = N sequences in the tree –2; or d.f = difference number of parameters H1 and H0
BootstrappingHow well supported are the groups? Trumpet fish
Maximum Parsimony Minimize tree length To obtain rooted trees (and character polarity) use an outgroup . The ingroup is monophyletic. Tree (first site) 5 changes 1 change G A • ATATT • ATCGT • GCAGT • GCCGT A G 3 1 A G G A G A 2 A 4 G
Maximum Parsimony-example Site 2 Site 3 T C A A A A C T A A C C T C C C C C Site 5 No changes Site 4 Tree length T G T T L = ki=1li T T G G T G T G
Maximum parsimony:example Sites 1 2 3 4 5 Total Tree ((1,2),(3,4)) 1 1 2 1 0 5 ((1,3),(2,4)) 2 2 1 1 0 6 ((1,4),(2,3)) 2 2 2 1 0 7 Phylogenetically informative sites
Networks • Phylogenetic representation allowing reticulation • More appropriate for intraespecific data • Ancestor is alive • hybridization, recombination, horizontal transfer, polyploidization agct 1 acat agct ac ct 2 3 4 5 7 6 acat acct agct
Multivariate clustering C1 C2 C3 C4 C5 C6 C7 1 2 3 4 5 5 X 7 • Y 2nd axis similarity criterion correlations • Z 3rd axis • • 7 x 7 • X 1st axis Calculate eigenvectors with highest eigenvalues Project data onto new axes (eigenvectors)