Statistical Hypothesis Testing Summary for Two-Tailed and One-Tailed Tests
200 likes | 325 Vues
This comprehensive review summarizes various statistical hypothesis tests, including two-tailed and one-tailed tests involving t-tests and z-tests. It encompasses decisions based on critical values, p-values, and the rejection of null hypotheses (H0) across multiple scenarios. Each test is detailed with critical values, test statistics, and decisions, demonstrating the application of hypothesis testing in evaluating differences in means and proportions for dependent and independent samples. This guide is essential for understanding hypothesis testing in statistical analysis.

Statistical Hypothesis Testing Summary for Two-Tailed and One-Tailed Tests
E N D
Presentation Transcript
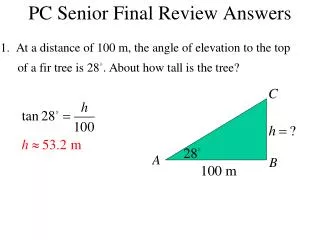
= 368 368 .05 25 - 1 = 24 Reject H Reject H 0 0 .025 .025 t -2.064 0 2.064 Two-Tailed t Test Solution -1 • H0: • Ha: • = • df = • Critical Value(s): Test Statistic: Decision: Reject at = .05 P-value = 0
= 70 70 .05 36 Reject H Reject H 0 0 .025 .025 -1.96 0 1.96 Z Two-Tailed Z Test Solution -2 • H0: • Ha: • = • n = • Critical Value(s): Test Statistic: Decision: Do not reject at = .05
= 32 < 32 .01 60 Reject .01 -2.33 0 Z One-Tailed Z Test Solution -3 • H0: • Ha: • = • n = • Critical Value(s): Test Statistic: Decision: Reject at = .01
= 3.25 3.25 .01 64 - 1 = 63 Reject H Reject H 0 0 .005 .005 t -2.656 0 2.656 Two-Tailed t Test Solution-4 • H0: • Ha: • • df • Critical Value(s): Test Statistic: Decision: Do not reject at = .01
= 140 < 140 .05 20 - 1 = 19 Reject H0 .05 t -1.729 0 One-Tailed t Test Solution - 5 • H0: • Ha: • = • df = • Critical Value(s): Test Statistic: Decision: Reject at = .05
= 5 <5 .05 10 - 1 = 9 One-Tailed t Test Solution -6 • H0: • Ha: • = • df = • Critical Value(s): Test Statistic: Decision: Do not reject at = .05 Reject H0 .05 t 0 1.833
p = .10 p < .10 .05 200 Reject H0 .05 -1.645 0 Z One-Proportion Z Test Solution - 7 • H0: • Ha: • = • n = • Critical Value(s): Test Statistic: Decision: Reject at = .05
p = .04 p .04 .05 500 Reject H Reject H 0 0 .025 .025 -1.96 0 1.96 Z One-Proportion Z Test Solution - 8 • H0: • Ha: • = • n = • Critical Value(s): Test Statistic: Decision: Do not reject at = .05
9 • Miles per gallon ratings of cars before and after mounting radial tires - DEPENDENT • The life expectancy of light bulbs made in two different factories - INDEPENDENT • Difference in hardness between two metals: one contains an alloy, one doesn’t - INDEPENDENT • Tread life of two different motorcycle tires: one on the front, the other on the back - DEPENDENT
1 - 2 = 0 (1 = 2) 1 - 2 0 (1 2) .05 11 -1 = 10 Reject H Reject H 0 0 .025 .025 t -2.228 0 2.228 Small-Sample Test Solution 10-A • H0: • Ha: • • df • Critical Value(s): Test Statistic: Do not reject at = .05
1 - 2 = 1% (1 = 2) 1 - 2< 1% (1 2) .05 11 -1= 10 Reject H0 .05 -1.812 0 t Small-Sample Test Solution 10-B • H0: • Ha: • • df • Critical Value(s): Test Statistic: Do not reject at = .05
Reject H Reject H 0 0 .05 .05 t 0 -1.761 1.761 Large-Sample Test Solution - 11 • H0: • Ha: • • n1 = , n2 = • Critical Value(s): 1 - 2 = 0 (1 = 2) 1 - 2 0 (1 2) .10 1515 Do not reject at = .10
d = 0 (d = A- B) d < 0 .10 4 - 1 = 3 Reject H0 .10 t -1.638 0 Paired-Difference Solution-12 • H0: • Ha: • = • df = • Critical Value(s):
d = 1Sd = 6.53 Computation Table Observation Before After Difference Sam 85 94 9 Tamika 94 87 -7 Brian 78 79 1 Mike 87 88 1 Total 4
Test Statistic: Decision: Do not reject at = .10
p1 - p2 = 0 p1 - p2 0 .01 78 82 Reject H Reject H 0 0 .005 .005 z 0 -2.58 2.58 Test for Two Proportions Solution -13 • H0: • Ha: • = • n1 = n2 = • Critical Value(s):
pMA – pCA = 0 pMA – pCA < 0 .05 1500 1500 Reject H0 .05 -1.645 0 Z Test for Two Proportions Solution - 14 • H0: • Ha: • = • nMA = nCA= • Critical Value(s):