Download
1 / 26
260 likes | 798 Vues
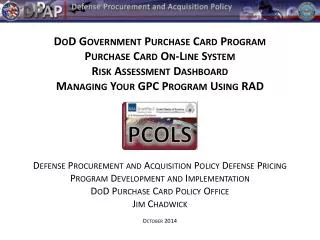
DoD Government Purchase Card Program Purchase Card On-Line System Risk Assessment Dashboard Managing Your GPC Program Using RAD. Defense Procurement and Acquisition Policy Defense Pricing Program Development and Implementation DoD Purchase Card Policy Office Jim Chadwick.

E N D
DoD Government Purchase Card Program Purchase Card On-Line System Risk Assessment Dashboard Managing Your GPC Program Using RAD Defense Procurement and Acquisition Policy Defense Pricing Program Development and Implementation DoD Purchase Card Policy Office Jim Chadwick October 2014
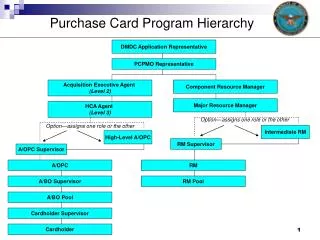
Risk Assessment Dashboard – Program Management GPC Program Management (Level 1 – PCPO) Risk Assessment Dashboard (RAD) is populated with bank data, Data Mining data, and PCOLS data. Bank daily and monthly transactional account data are used. DM case and case disposition data are used. PCOLS hierarchy and account data are used. Component Program Management (Level 2) Drill down at the control level. All subordinate organizations are displayed. MACOM, MAJCOM, Agency Program Management (Level 3) Drill down at the exception level. Only the exceptions for the subordinate organizations are displayed.
RAD – Account & Control Management A/OPC and A/BO Dashboard are used mainly to manage the exceptions at the cardholder account level. A/BO Dashboard does not display controls that are not applicable at the A/BO Level.
General Dashboard Navigation Cycle − Current cycle is the default. Total of 18 billing cycles to choose from. Overall Risk Assessment − The Overall Risk for the user’s hierarchy level. Hierarchy Level Count − The Hierarchy Level Count element displays the number of sub-organizations, based on TBR, one level below the reporting level. Category Label − The Category Label element applies to groups of controls. Control Title and Description − Identifies and describes each control. Control Risk Assessment Exception Scale − The Control Risk Assessment Exception Scale element is available only on A/OPC dashboards. It contains ranges or numbers used to determine the risk assessment for a control based on where the Exception Count falls when compared to the scale. The ranges or numbers correspond to low-risk, medium-risk, and high-risk. The Control Risk Assessment Exception Scale element is specific to individual controls. Exception Count − The Exception Count element is only available on the A/OPC and A/BO dashboards. It displays the number of exceptions identified for a control. For example, for Control 4.2: Account Usage, any Cardholder who has not used their card in the past six billing cycles is identified as an exception. The Exception Count element is specific to individual controls. Control Risk Assessment − The Control Risk Assessment element indicates the risk assessment for a control. A control can be assessed as low risk, medium risk, or high risk, except for the A/BO dashboard where a control can only be assessed as either low risk or high risk. Depending on the dashboard, the Control Risk Assessment is determined by comparing the Exception Count to the Control Risk Assessment Exception Scale. The Control Risk Assessment element is specific to individual controls.
A/BO Dashboard Risk Scale At the A/BO Dashboard Level if any exception is observed, then the control will go Red (i.e., there are only two categories at this level – Green (No Exceptions) and Red (Any Exception).
Calculation of Overall Risk Assessment (A/BO Dashboard) • Each control risk level has a corresponding numeric Risk Value: • Low (Green) = 0 • Medium (Yellow) = 1 • High (Red) = 5 • Eleven (11) Total Controls • Nine Green (Low) = 9 * 0 = 0 • Zero Yellow (Medium) = 0 * 0 = 0 • Two Red (High) = 2 * 5 = 10 • Overall Risk Value = 0 + 0 + 10 = 10 • The overall risk assessment scale used to calculate risk level at A/BO Level Dashboard is used in the calculation of the Overall Risk Value (above). That Overall Risk Value is used to assign Overall Risk Assessment for the A/BO Level Dashboard. Scale is as follows: • Low (Green) :0 - 6 • Medium (Yellow): 7 - 14 • High (Red):15 - 60 • This A/BO has an Overall Risk Value of 10, which falls in the Medium category (Yellow). • Yellow is displayed as the Overall Risk Assessment.
A/OPC Assessment and Organization Level Dashboard Risk Scale Higher level dashboards use a different scale. Note on the A/OPC Dashboard that the number of exceptions for each risk level is displayed next to the control scale. As an example, see dashboard display below:
Calculation of Overall Risk Assessment (A/OPC Dashboard: Example 1) • Each control risk level shall have a corresponding numeric Risk Value: • Low (Green) = 0 • Medium (Yellow) = 1 • High (Red) = 5 • Twelve (12) Total Controls • Eleven Green (Low) = 11 * 0 = 0 • Zero Yellow (Medium) = 0 * 0 = 0 • One Red (High) = 1 * 5 = 5 • Overall Risk Value = 0 + 0 + 5 = 5 • The Overall Risk Assessment Scale used to calculate risk level at A/OPC Level Dashboard is used in the calculation of the Overall Risk Value (above). That Overall Risk Value is used to assign Overall Risk Assessment for the A/OPC Level Dashboard. Scale is as follows: • Low (Green) :0 - 6 • Medium (Yellow): 7 - 14 • High (Red):15 - 60 • This A/OPC has an Overall Risk Value of 5, which falls in the Low category (Green). • Green is displayed as the Overall Risk Assessment.
Calculation of Overall Risk Assessment (A/OPC Dashboard: Example 2) • Each control risk level shall have a corresponding numeric Risk Value: • Low (Green) = 0 • Medium (Yellow) = 1 • High (Red) = 5 • Twelve (12) Total Controls • Nine Green (Low) = 9 * 0 = 0 • One Yellow (Medium) = 1 * 1 = 1 • Two Red (High) = 2 * 5 = 10 • Overall Risk Value = 0 + 1+ 10 = 11 • The Overall Risk Assessment Scale used to calculate risk level at A/OPC Level Dashboard is used in the calculation of the Overall Risk Value (above). That Overall Risk Value is used to assign Overall Risk Assessment for the A/OPC Level Dashboard. Scale is as follows: • Low (Green) :0 - 6 • Medium (Yellow): 7 - 14 • High (Red):15 - 60 • This A/OPC has an Overall Risk Value of 11, which falls in the Medium category (Yellow). • Yellow is displayed as the Overall Risk Assessment.
Calculation of Overall Risk Assessment (HCA Agent (Level 3) Dashboard) • Each control risk level has a corresponding numeric Risk Value: • Low (Green) = 0 • Medium (Yellow) = 1 • High (Red) = 5 • Twelve (12) Total Controls • Four Green (Low) = 4 * 0 = 0 • Five Yellow (Medium) = 5 * 1 = 5 • Three Red (High) = 3 * 5 = 15 • Overall Risk Value = 0 + 5+ 15 = 20 • At the HCA Agent Level Dashboard and above, the Risk Values are based on the exceptions of the subordinate organizations. In this example, there are six (6) sub-orgs. So, the Risk Values for each control total six. The Overall Risk Value calculated above is used to assign Overall Risk Assessment for this dashboard. Scale is as follows: • Low (Green) :0 - 6 • Medium (Yellow): 7 - 14 • High (Red):15 - 60 • This HCA Agent has an Overall Risk Value of 20, which falls in the High category (Red). • Red is displayed as the Overall Risk Assessment.
Calculation of Risk Values To calculate the risk assessment score for a control, the number of direct, lower level A/OPCs that were assessed as low, medium, and high risk for the control are multiplied by the risk weightings of 0, 1, and 2 respectively and summed together. This value is the Total Risk Score for the control. Before the assessed risk level of the control can be determined, the Maximum Risk Score must be calculated. The Maximum Risk Score is calculated by multiplying the total number of direct, lower level A/OPCs by the high risk weighting of 2. The Maximum Risk Score is the value if all the A/OPCs where assessed as high risk (Red) for the control. To determine the assessed risk level of the control from the total risk score, the total risk score is evaluated against the A/OPC control scale shown below. If the total risk score is less than 25% of the maximum risk score, the control is assessed as low risk (Green). If it is greater than or equal to 25% and less than 52%, the control is assessed as medium risk (Yellow). A risk score that is greater than or equal to 52% of the maximum risk score is assessed as high risk (Red). Previous example of HCA Agent has a Total of 6 Level 4s. 6 sub-orgs – Maximum Risk Score = 12. Control 1.16 green = 6*0 = 00 yellow = 0*1 = 0 0 red = 0*2 = 0 0 + 0 + 0 = 00/12 = 0% = Green Control 1.23 green = 3*0 = 0 0 yellow = 0*1 = 0 3 red = 3*2 = 6 0 + 0 + 6 = 66/12 = 50% = Yellow Control 2.14 green = 4*0 = 0 1 yellow = 1*1 = 11 red = 1*2 = 2 0 + 1 + 2 = 33/12 = 25% = Yellow Control 5.22 green = 2*0 = 0 1 yellow = 1*1 = 13 red = 3*2 = 6 0 + 1 + 6 = 77/12 = 58% = Red
Risk Assessment Dashboard – Control 1.1 • Control 1.1: Cardholder Accounts to Managing Accounts • More than seven Cardholder Accounts to one Managing Account • Issue came up where Control 1.1: Accounts that have been cancelled or closed are still being identified and counted against the 7:1 ratio. • We have put the fix in to production for Control 1.1, so when the June monthly file was processed, accounts cancelled during the cycle were properly excluded from the counts. Also, clean-up for past cycles was performed. This issue should be resolved going forward. • Also, we have seen where exceptions were granted out of SAF/AQC. While the Air Force may grant an exception, this exception does not apply at the DoD OSD Level (i.e., there will be no relief for this control).
Risk Assessment Dashboard – Control 1.2 • Control 1.2: Accounts to A/OPC TBR • More than 300 accounts to 1 A/OPC TBR Level • Control 1.2 verifies the ratio of Managing and Cardholder accounts to A/OPC TBR Level (this is the role and not the number of folks that are in that role). • Please note that the control is operating as designed. Currently, the control uses the A/OPC TBR Level in the calculation. PCPO does understand that this is a different definition than in the Charge Card Guidebook where it states: “There should be no more than seven card accounts per A/BO or Certifying Officer, and no more than 300 accounts (CH and A/BO) per A/OPC.” • This difference is slated as a topic for a conversation at the next PCOLS IPT.
Risk Assessment Dashboard – Control 2.1 • Control 2.1: Inadequate Separation of Duties • Accounts for which the Cardholder and A/BO are the same individual • Good news here is that once that this situation was brought forward corrective action was taken.
Risk Assessment Dashboard – Control 3.1 • Control 3.1: Spending Ratio – Underutilized Credit Limits • Accounts for which the three-cycle spend average is less than 70% of the average cycle credit limit. • Currently, this control uses that last month’s cycle limit in the calculation. This control is being updated the average the cycle limit. Also, there is a situation where cancelled accounts are being included in the calculations. This will be fixed by eliminating accounts that are cancelled in the reporting cycle. Additionally, there does appear to be an issue with credit balances. This will be fixed when average fix goes in. • Issues with the flow of funds is not something that can be addressed with this control (i.e., this would be an operational issue and not an application issue).
Risk Assessment Dashboard – Control 3.2 • Control 3.2: Single Merchant Spending. Accounts that have at least 10 transactions and an 80% or greater spending percentage at one merchant. • PCPO is aware that some mandatory sources are causing issues with this control as well as the flagging in Data Mining. We are looking at how to address these issues. • PCPO will need to look into the situation where itemized billing is being used (i.e., each item appears as a separate transaction).
Risk Assessment Dashboard – Control 4.1 • Control 4.1: Delinquent Accounts • Managing Accounts delinquent for more than 30 days • Good news here is that this control alerted an organization that an account was delinquent and the account is now in compliance.
Risk Assessment Dashboard – Control 4.2 • Control 4.2: Account Usage • Accounts that have been inactive for six cycles or have never been used • PCPO is aware that there are mitigating issues associated with this control. For example, funds were expected to be available and then were not available for purchase card purchases. Also, that there are many contingency cards that would only be used in contingency situations (i.e., they do not have regular spend). • Some good news here is that this control alerted some organizations of cards that were not needed and were closed (therefore reducing risk).
Risk Assessment Dashboard – Control 4.3 • Control 4.3: Lost/Stolen Cards • Managing Accounts that have more than one lost/stolen card(s) in the last six cycles • We did recognize an issue with the Bank file and this has been addressed. If there are continuing issues, I would like to investigate. • Also, we are looking at the weighting of this control. This one would probably be the first to try a different weight in dashboard. In some cases, the compromised card is totally out of the cardholders control.
Risk Assessment Dashboard – Control 5.1 • Control 5.1: Average Cycle Transactions • Higher than average number of transactions (>100) for a Managing Account per cycle, based on three cycles of data • PCPO does understand that some organizations are going to have more than 100 transactions per cycle. The number of transactions is going to be analyzed. Also, question came up regarding the a monthly cap on the number of transactions. • Performed some quick math on those orgs that had very high exceptions. Raising the average number to 150 would clear about 70% of the exceptions. Again, looking at modifying the control to be a better indicator or risk. Note that some accounts have 400 average transactions.
Risk Assessment Dashboard – Control 5.2 • Control 5.2: A/BO Response Rate • A/BO failure to complete case review in Case Management for flagged transactions within 16 business days • We are now including the A/OPC on the second escalation to A/BO, A/BO Supervisor, and alternate A/BO to give the A/OPC five business days to clear the case before it goes red in RAD. • Also, there are no exceptions for this control (i.e., issue with foreign/local nationals that participate in the GPC Program).
A/BO Response Rate Old Current Other items to address issues: Escalated Transaction Report has been fixed to show “Pending” escalations. Email notification process for “Pending” emails has been addressed. Update to the Notification Schedule and email Distribution was approved at the ORC on April 9th.
Escalation Schedule Notify A/OPCs earlier in the escalation cycle Closed Case emails are being sent to A/OPCs
Risk Assessment Dashboard – Control 5.3 • Control 5.3: Flagged Transaction Determination • Flagged transactions determined to be other than valid in Case Management (Misuse/Abuse/Suspected Fraud) • One of the issues here is how to account for third party fraud. An example would be where a card has been compromised and then used fraudulently. In this situation, the disposition should be Lost/Stolen. • Suspected Fraud here is referring to first party fraud. This would be where the cardholder (or accomplices) was involved in the fraudulent activity.
Risk Assessment Dashboard – Control 5.4 • Control 5.4: Convenience Check Amounts • Accounts that have a Convenience Check transaction for more than $3,000 • Have not seen too many exceptions or issues with this control.
Risk Assessment Dashboard – Quarterly Reports Quarterly Reports are a side-by-side comparison of the exceptions from the corresponding dashboards. Each on the categories is displayed on a separate page. This example shows a Level 4 Report that reports on the two sub-orgs under the Level 4.