Download
1 / 39
400 likes | 595 Vues
Implications of Total Energy Intake for Epidemiologic Analyses Nutritional Epidemiology Walter Willet. Three reasons that total energy intake deserves special consideration in nutritional epidemiology. 1. The level of energy may be a primary determinant of disease.

E N D
Implications of Total Energy Intake for Epidemiologic Analyses Nutritional Epidemiology Walter Willet
Three reasons that total energy intake deserves special consideration in nutritional epidemiology 1.The level of energy may be a primary determinant of disease. 2. Individual difference in total energy intake produce variation in intake of specific nutrients unrelated to dietary composition because the consumption of most nutrients is positively correlated with total energy intake. This added variation may be extraneous, and thus a source of error, in many analyses. 3. When energy intake is associated w/ disease but is not a direct cause, the effects of specific nutrients may be distorted or confounded by total energy intake.
§ PHYSIOLOGIC DETERMINANTS of ENERGY UTILIZATION • Physiologists have partitioned energy expenditure into several components: resting metabolic rate, thermogenic effect of food, physical activity, and adaptive thermogenesis (Fig. 1.1). - RMRs are quantitatively the most important, representing ~60% of total energy expenditure in most individuals. - Thermogenic effect of food (the metabolic cost of absorbing and processing CHO, protein, and fat) varies w/ the sources of energy, but is only ~10% of the total. - Adaptive thermogenesis represents the capacity of an individual to conserve or expend energy in response to variable intake of food or temperature extremes. In humans it is defined differently by various investigators and is difficult to measure. It is estimated to be < 10% of calories. - Physical activity accounts for ~30% of energy intake in a moderately active individual.
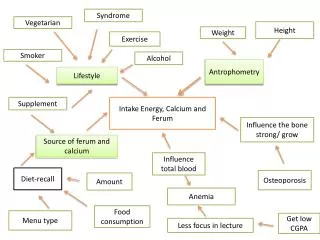
Determinants of Between-Person Variation in Total Energy Intake - Factors influencing energy intake can generally be considered as 3 categories: body size, metabolic efficiency, and physical activity. Departures from energy balance, that is, change in body energy stores due to intake above or below expenditure, also account for part of the observed variation among persons (Fig 11-2). • Body size: • affects the amount of energy needed for resting metabolic activity. • the primary determinants of • energy expenditure, particularly at • low levels of physical activity • (Fig11-3).
1 2
(continued from body size issue) • Neither height nor weight account for a major proportion of the between-person variation in total caloric intake among free-living subjects of the same gender and similar size. • Underreporting of intake by clearly obese subjects has been documented and could explain some of the lack of a positive association between weight and energy intake. • Body size would become a more important determinant of variation in energy intake among free-living subjects if analysis were conducted on groups markedly heterogeneous in size.
Physical activity: • REE does not vary greatly among individuals of similar age and sex. Physical activity assumes a relatively large role in determining the variation in energy expenditure among free-living individuals. • The positive relationship between PA and energy intake has been appreciated for years and has been clearly documented (Table 11-1). • The true proportion of variation in energy intake accounted for by PA varies substantially among populations and is likely to be seriously underestimated in most studies because of difficulty in accurately measuring PA. • PA, which includes both fine motor and major muscle movement, is the dominant explanation for between-person differences in energy intake. In most instances, total energy intake can be interpreted as a crude measure of PA, particularly after controlling for body size, age and sex.
Metabolic efficiency: • Metabolically inefficient persons require greater amounts of energy to maintain their level of activity and weight. • The mechanisms and determinants of metabolic efficiency (including differences in absorption and the general category of thermogenesis) are poorly defined in humans. • Increased energy intake appear to reduce metabolic efficiency, in other words to increase thermogenesis. • Extra calories added to the diets of most persons are mainly stored as fat these individuals are already operating at maximal thermogenesis. • Some modest capacity to increase metabolic efficiency (reduce thermogenesis) exists during underfeeding, thus aggravating attempts to lose weight. • No practical method of measuring metabolic efficiency in an epidemiologic setting. There is relatively little between-person variation in energy expenditure after PA has been restricted and weight is accounted for (Fig 11.3) the contribution of metabolic efficiency to between-person variation variation in energy expenditure remains poorly defined but is not likely to be large.
Energy balance: • The net balance of energy intake in relation to body size, metabolic efficiency, and PA determines whether a person gains or loses weight. • During short periods (such as months) the proportion of energy intake accounted for by balance (i.e., weight gain or loss) is larger if some persons are experiencing rapid weight change. Over the long-term, however, balance can account for only a very small part of between-person differences in energy intake. • Differences in total energy intake between individuals are largely determined by PA, body size, and metabolic efficiency it is apparent that an epidemiologic study of only energy intake in relation to disease risk is difficult or impossible to interpret. • Measures of weight and height can be extremely useful as alternatives to direct measures of energy intake. The presence of high relative weight implies that, sometime in life, a positive balance between energy intake and energy expenditure has occurred. A change in weight implies a positive or negative energy balance during that time.
The interpretation of epidemiologic data relating to weight and energy intake depends in an important way on how body weight responds to increased energy intake (Fig. 11-4). • Data based on rats indicate that gain in body weight is a linear function of energy availability (model 2 in Fig 11-4). A review of metabolic studies among humans indicates that any adaptive response in thermogenesis occurs only after some change in adiposity. it seems appropriate to interpret a lack of association w/ relative weight in a specific study as evidence against a direct causal effect of total energy intake on risk of disease.
Model 1: increased energy intake is fully compensated by adaptive thermo-genesis up to a certain point, and weight gain occurs only after a threshold increase in caloric intake is exceeded. Model 2: any long-term increase in energy intake causes weight gain; any compensatory increase in thermogenesis occurs only in conjunction with weight gain.
Relation of Energy Intake w/ Specific Nutrient Intake • Intakes of most nutrients in free-living populations tend to be positively correlated w/ total energy intake. • Data (four 1-week diet records, 194 women) (Table 11-2) show that correlations were particularly strong for fat, protein, and CHO (contribute to energy intake); alcohol intake was quite modest and was only weakly correlated w/ total energy consumption. Every other nutrient examined was also correlated w/ total energy intake even though many did not contribute to energy (e.g., correlations w/ energy was 0.24 for fiber, 0.25 for vit. A, and 0.19 for vit. C). • Composition of diets may vary by level of total caloric intake, depending on the behavior of the population: - (Table 11-3) women w/ lower energy intake tend to have a proportionally higher intake of fiber than women w/ higher energy intake.
The correlations between caloric intake and specific nutrient intakes highlight the need to consider total energy intake when interpreting associations between specific nutrients and disease in epidemiologic studies.
§ ADJUSTMENT for ENERGY INTAKE in EPIDEMIOLOGIC ANALYSES • Nutritional factors may be examined in terms of absolute amount (crude intake) or in relation to total caloric intake. The approach depends on both the nature of the biologic relationship and the public health considerations. • if a nutrient is metabolized in approximate proportion to total caloric intake (e.g., macronutrients and some vitamins), nutrient intake is most likely biologically important in relation to caloric intake. To the extent that energy intake reflects body size, adjustment for total energy intake is usually appropriate as an absolute amount of a specific nutrient tends to have less of an effect for a larger, higher energy-consuming person than for a smaller person. • if a nutrient selectively affects an organ system that is uncorrelated w/ body size (e.g., central nervous system), or if physical activity does not affect its metabolism, absolute intake may be most biologically relevant.
Most alterations in absolute nutrient intake must be accomplished by changing the composition of the diet rather than the total amount of food. It has been suggested that dietary recommendations should be made in reference to total caloric intake (e.g., reduction of fat intake to 30% of total caloric intake). • In epidemiologic studies, nutrient intakes adjusted for total energy intake, rather than absolute nutrient intakes, are of primary interest in relation to disease risk. Adjusting nutrient intakes for total energy intake in epidemiologic studies can also be viewed as being analogous to animal experiments or metabolic studies in humans. • To determine whether an effect is due to a nutrient per se, it is essential that the diets being compared are isocaloric. • When total caloric intake is associated w/ disease, the interpretation of individual nutrient intake is complex. Specific nutrients tend to be associated w/ disease simply on the basis of their correlation w/ caloric intake.
Variation in caloric intake between persons largely reflects physical activity, size, and metabolic efficiency an association between a specific nutrient and disease is not likely to be of primary etiologic importance if that association is simply the result of a difference in caloric intake. • It is possible that overeating or undereating (caloric excess or deficiency) is a primary cause of a disease. In this situation, higher intakes of nutrients that contribute to calories might be considered as the primary exposures that lead to increased total caloric intake, which in turn causes disease. • Before attributing an effect to a specific nutrient, the burden is on the epidemiologist to demonstrate that the association of this nutrient w/ disease is independent of caloric intake.
§ Analyses of Diet-Disease Relationships by the Use of Nutrient Densities. • Nutrient densities: measures of dietary composition computed by dividing nutrient values by total caloric intake. For macronutrients, the analogous approach is to express intake as a percentage of total caloric intake. • When energy intake is unrelated to disease, dividing nutrient intakes by total calories may have the desired effect of reducing the variation in nutrient intake that is due to differences in size, activity, and metabolic efficiency. The division, however, also can create unwanted variation, particularly when a specific nutrient has a weak correlation w/ total energy intake or has a low variability. • Nutrient density can be viewed statistically as an interaction like any ratio. This ratio is in itself biologically meaningful; it would be expected that the effect on an absolute intake of a specific nutrient would be greater at low energy intakes than at high energy intakes.
A nutrient density variable contains the inverse of energy intake as a component, nutrient densities tend to be associated w/ disease in the direction opposite to that of total caloric intake, even when the nutrient itself has no association w/ disease independent of energy intake. • In some studies, the reason for an association between energy intake and risk of disease may be obscure. ex. Case-control study of large bowel cancer (Jain M et al., 1980) - cancer patients reported higher caloric intake than did controls but did not weight more than the controls (crude intake in Table 11-5); cancer patients also consistently reported higher fat intakes than did noncases. - it is useful to consider possible explanations for the difference in caloric intake between cases and controls in interpreting the above findings: the possibility that cases have a metabolic abnormality that renders them less efficient in their utilization of food energy cannot be dismissed.
1 2
(continued from the example) - recall bias cannot be dismissed as an explanation in the above findings. - when calculated as nutrient densities, the association w/ total fat intake essentially disappears for men and is largely eliminated for women (nutrient density intake in Table 11-5). Strong inverse associations are seen for fiber and vitamin C intakes expressed as nutrient densities, which had not association w/ cancer in the crude analysis. - the nutrient density analysis overstates the protective association of fiber and vitamin C and underestimates the effect of fat, because dividing by caloric intake produces inverse associations even when these nutrients are not independently associated w/ disease. - subsequent prospective findings are consistent w/ the clear evidence of a protective effect of physical activity against colon cancer and strongly suggest that the case-control findings w/ total energy intake were due to methodologic bias. This discordance raises serious concerns regarding the validity of case-control studies of diet and cancer.
§ ALTERNATE APPROACHES TO ADJUST FOR TOTAL ENERGY INTAKE • In epidemiologic analyses it is always desirable to employ a measure of nutrient intake that is independent of total energy intake, particularly when energy intake is associated w/ disease. • Four analytic strategies: the “energy adjusted” method, the standard multivariate method, the “energy decomposition” method, and the multivariate nutrient density method. • Energy-Adjusted/Residual Method • “Energy-adjusted” nutrient intakes are computed as the residuals from the regression model w/ total energy intake as the independent variable and absolute nutrient intake as the dependent variable (Fig 11-5). • The nutrient residuals by definition provide a measure of nutrient intake uncorrelated w/ total energy intake.
For macronutrients, if expressed in units of calories (e.g., calories from fat), the residuals can also be conceptualized as the substitution of that nutrient for a similar number of calories from other sources. • This model can also be viewed as analogous to animal or metabolic feeding studies in which total energy is held constant, but the amount of the nutrient being evaluated is varied between the groups being compared. • Because residuals have a mean of zero and include negative values, they do not provide an intuitive sense of actual nutrient intake. It may be desirable to add a constant; logical choices are the predicted nutrient intake for the mean energy intake of the study population or a round number for energy intake near the population mean. • Example: daily intakes of total calories and total fat based on the means of four 1-week diet records by each of 194 women (Willett et al., 1985)(Fig 11-6).
The unadjusted intake of total fat has a reasonably wide distribution (mean=68.9, SD=17.0 g/day). • Because total fat and total caloric intake are highly correlated (r=0.86), adjustment for total caloric intake reduces the variation in fat intake substantially (mean=68.9, SD=8.7 g/day; shaded area)
When total energy intake is an important predictor of disease, total caloric intake should be included in the model w/ the nutrient calorie-adjusted term: Disease=b1Nutrient residual+b2Calories (model 2, Table 11-6). • This approach is preferable to entering only calorie-adjusted nutrient into a model, as the random error (and width of confidence limits for the effect of the nutrient may be reduced if caloric intake has an important association w/ the outcome independent of nutrient intake. • Another advantage of using model 2 rather than model 1 is that the full effect of total caloric intake can be observed. • The Standard Multivariate Method • Includes both caloric intake and absolute nutrient as terms in a multiple regression model w. disease outcome as the dependent variable Disease=b3Calories + b4Nutrient (model 3, Table 11-6)
The coefficient for the nutrient term (b4) in the multivariate model (model 3) is identical to that for the calorie-adjusted nutrient term in a univariate model (b1). • With total caloric intake also in the calorie-adjusted model (model 2), the standard error as well as the coefficient for the calorie-adjusted nutrient term (b1) is identical to that for the nutrient term (b4) in the standard multivariate model w/ nutrient and calories.
Standard multivariate method (model 3) vs. residual method (model 2): - In model 3, calories and nutrient are entered as separate terms, the coefficient for calories (b3) represents calories independent of the specific nutrient, which may have a meaning distinctly different from total energy intake. Thus the inclusion of a specific nutrient together w/ calories in a model fundamentally changes the biologic meaning of calories. The coefficient for calories in model 3 may fail to attain significance when total energy intake has a significant and important relation w/ disease. - The two terms in model address two distinct and clear questions: (1) is total energy intake associated w/ disease? (2) is the nutrient composition of the diet related to disease?. - The use of the standard multivariate model can also create confusion between the distributions of crude nutrient intake and the nutrient intake independent of energy intake. - The issue of collinearity should be concerned when strongly correlated variables are simultaneously included in the same model, which will frequently occur using the standard multivariate model.
The “Energy Decomposition”/”Energy Partition” Method: • Separate terms for energy from a specific macronutrient(such as fat) and for energy from other sources (protein, CHO, and alcohol) are entered into the model: Disease=b5CalNutrient1 + b6Calother2 (model 4, Table 11-6) 1 calories provided by the specific nutrient; 2 calories from sources other than the specific nutrient. • This model implies that more of the nutrient could simply be added to one diet, keeping the other nutrients constant. Thus, this is not an isocaloric comparison, and any observed association w/ the nutrient can still be confounded by total energy intake. • The coefficient for the specific macronutrient (b5) represents the full effect of the nutrient unconfounded by other sources of energy (b6), but this model does not directly address the question of whether energy from the specific nutrient has an association w/ disease not shared by other sources of energy.
Although the “energy decomposition” model may provide insight in some instances, its coefficients may be misleading unless interpreted with care, particularly when total energy intake has a noncausal relationship w/ disease. • An additional limitation of this model is that it cannot be readily extended to nutrients that do not contribute to energy intake. • Multivariate Nutrient Density Model • The nutrient density is computed and then entered together w/ the total energy into a multiple logistic regression model: Disease=b7Nutrient/Calories + b8Calories (model 5, Table 11-6) • The coefficient for the nutrient density term (b7) represents the relation of the nutrient composition of the diet w/ disease, holding total energy intake constant; thus, this method is an “isocaloric” analysis and dose control for confounding by energy intake. • This model overcomes the primary statistical problem associated w/ the use of the nutrient density alone, while retaining its attractive features of general recognition and intuitive interpretation as a measure of dietary composition.
The coefficient for calories in this model (b8) will generally be interpretable as representing the effect of calories in the usual biologic sense because nutrient densities are not inherently part of or highly correlated w/ total energy intake. • This model may be particularly advantageous when body size (and thus total energy intake) varies greatly among subjects because models 2 and 3 imply that the nutrient residual has a similar effect for subjects w/ high and low energy intake. • The energy determinant method: - An alternative approach, in theory, would be to include the major determinants of energy intake (body size, physical activity, and metabolic efficiency) as separate variables in a multivariate model. It could be informative to include as many of these variables as possible along w/ total energy intake as independent variables. - Because energy intake and disease outcome may differ in their relationships w/ body components such as lean mass and fat, it would be desirable to include both height and a measure of fatness uncorrelated w/ height as separate terms in a multivariate model.
Implications of non-normality and heteroscedasticity: - Actual dietary data generally do not have the simple, approximately normal distributions. - Typically, energy intake and the nutrient intake are skewed toward higher values, and the variation in nutrient intake (and thus the residuals) is greater at higher total energy intake (Fig 11-7, for example, using saturated fat). The lack of constant variation in the residuals across level of the independent variable (heteroscedasticity) is in principle a violation of usual regression assumptions and, if ignored, has serious implications for the various methods of energy adjustment. - It has been pointed out that if the residuals from heteroscedastic data are divided into categories, subjects in both the highest and lowest categories will tend to have the highest energy intake. - Transformations, such as taking logarithms of the variables, are typically used to create residuals w/ a more constant variance across the independent variable (Fig 11-8). As a result, subjects will contribute similarly to information on dietary composition and disease risk regardless of their energy intake.
- The effects of heteroscedasticity are most transparent in the use of residuals as a measure of dietary composition. The same issues exist with the standard multivariate model, but may not be appreciated because the residuals from one independent variable regressed on another are not typically examined. - The impact of non-normally distributed variables is less clear in the “energy decomposition” model, but it is likely that variability in the nutrient of interest could differ by level of energy intake from other sources in some circumstances. • More complex models: - In principle, the analytic approaches listed above could be extended to include other nutrients as well. For example, one could use the energy-adjustment approach (model 2) to compute calorie-adjusted residuals for both protein and fat and include both along w/ total calories in the same model, or one can use the energy decomposition method to enter energy from fat, protein, and CHO as three separate terms. - The capacity to include multiple energy-adjusted nutrients in a model simultaneously will be limited by their intercorrelations and the size of the dataset. - The inclusion of additional nutrient terms to these models should be done w/ caution as the interpretation of even the two-variable models can be complex.
Categorization of nutritional variables: - Reasons for analyzing nutrients in categories: (1) the capacity to compute relative risks for actual groups of subjects; (2) the avoidance of imposing a dose-response relationship (such as linear) that does not actually exist; and (3) the ability to avoid undue influences of outlier values. - Alternative arguments exist for using continuous variables, including the maximization of statistical power; a thorough analysis will usually involve both approaches. - In conducting categorical nutrient analyses, it is important to recognize that the statistical interchangeability of the standard multivariate, energy partition, and residual models does not apply.
Implications for Food-Frequency Questionnaire Data • The meaning of energy intake computed from simple or semi-quantitative FFQs may be less clear than that from more quantitative methods. • To the extent that subjects w/ higher caloric intake simply consume larger portion sizes rather than more food items, nutrient intakes may be inherently adjusted for total caloric intake. This adjustment, however, is likely to be only partial at most because many food items (e.g., eggs, bread, and apples) come in pre-determined units. • Although energy intake data from FFQs may be imperfect and thus not fully represent the effects of body size, activity, metabolism, and energy balance, it would still be appropriate to use this measure for the computation of energy-adjusted intakes as described previously. • In general, underreporting has been greater among women and obese persons. While underreporting of total energy intake is an important issue in some circumstances, it is not a major issue in epidemiologic analyses because dietary composition is the primary focus; moreover, the major correlates of underreporting such as age, gender, and body fat are accounted for in typical analyses.
Although adjustment for total energy intake based on a FFQ should reduce confounding by energy intake, because both the nutrient and the energy intake are imperfectly measured control of confounding may not be complete. • Data from a validation study can be extremely useful to evaluate the degree to which confounding has been controlled.