Download
1 / 35

E N D
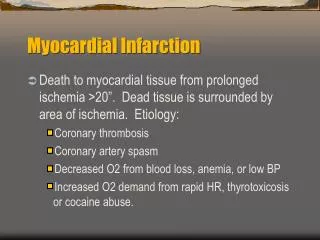
1. Myocardial Ishcemia and Infarction Chapter 8: St Segment Elevation Ischemia and Q Wave Infarct Patterns
2. Terminology Ischemia
Angina Pectoris
Necrosis
Myocardial Infarction
Epicardium
Subendocardium
TransmuraL
three major coronary arteries
3. Transmural Ischemia Acute Phase
St segment elevation
Sometimes tall T waves in certain leads
Acute phase may last hours to days
4. Transmural Ischemia Evolving phase
T wave inversion in the leads where the previously showed ST segment elevation
5. Transmural Ischemia Location
Anterior
Leads V1 - V6, I and aVl
Inferior
Leads II, III and aVf
6. Anterior MI
7. Inferior MI
8. Recipocity
10. ST Elevation The ST elevation seen with acute MI is called a �Current of injury�
ST segment elevations are the earliest ECG signs of acute MI
11. Q Waves Q waves are characteristic markers of infarction. (But not all transmural infarcts lead to Q waves.)
New Q waves of an MI generally appear with the first day or two
With an Anterior MI, these Q waves are seen in one of more of leads V1-V6, I and aVl
With an Inferior MI, these Q waves are seen in one of more of leads II, III and aVf
12. Normal Q Waves
14. Normal and Abnormal Q Waves Normal
Narrow (less than 0.04 sec), Low amplitude
Abnormal if greater than 0.04 sec in leads I, II, III, aVf or leads V3 - V6.
Wider Q waves in V1, V2, III, and aVf can be normal
Not all Q waves are abnormal, Not all Q waves are the result of MI.
15. Anterior Infarctions Anterior MI show loss of R wave progression in the chest leads
Anterospetal Infarcts: Loss of R waves in V1 and V2
�Strictly� Anterior Infarcts: Loss of R waves in V3 and V4
Anterolateral or Anteroapical infarcts: abnormal Q waves in V5 and V6
21. Inferior Infarctions Abnormal Q waves in leads II, III, and aVF
23. Other Posterior Infarctions
Right Ventricular Infarctions
Ventricular Aneurysm
Multiple Infarctions
�Silent� MI
MI with Bundle Branch Block
24. Myocardial Ischemia and Infarction Chapter 9: St Segment Depression Ischemia and non-Q Wave Infarct Patterns
25. Subendocardial Ischemia Inner layer
St Segment depression
Anterior leads (I, aVl and V1-V6)
Inferior leads (II, III, and aVf)
May see ST segment elevation in aVr
26. Subendocardial Ischemia
27. Subendocardial Ischemia Transient ST segment depression
ST segment depression often occurs with angina, which generally returns to baseline when the angina subsides
28. Subendocardial Ischemia Exercise
29. Subendocardial Ischemia ST segment depression criteria
1 mm or more
horizontal or downward
lasts 0.08 seconds
depression of only the J point with rapid upward sloping are considered normal.
30. Subendocardial Ischemia False-Positive
ST depression without disease
False-Negative
Disease without ST depression
Silent Myocardial ischemia
31. Subendocardial Infarction Persistent ST depression
32. Subendo-cardial Infarction
33. Non-Specific ST-T changes Subtle changes
slight flattening of T wave
minimal T wave inversion
34. Prinzmetal�s Angina Transient ST segment elevation with angina
No Q waves, no T wave inversion
Angina may occur at rest or at night
Coronary artery spasm