Download
1 / 20
210 likes | 360 Vues
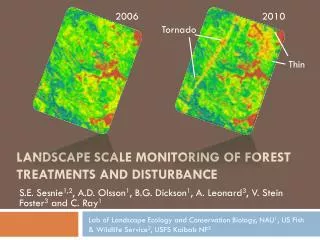
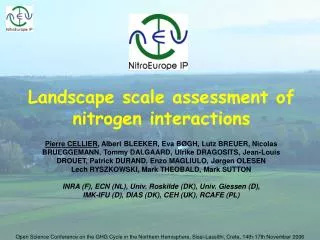
Landscape scale assessment of nitrogen interactions. Pierre CELLIER , Albert BLEEKER, Eva B Ø GH, Lutz BREUER, Nicolas BRUEGGEMANN, Tommy DALGAARD, Ulrike DRAGOSITS, Jean-Louis DROUET, Patrick DURAND, Enzo MAGLIULO, J ø rgen OLESEN Lech RYSZKOWSKI, Mark THEOBALD, Mark SUTTON

E N D
Landscape scale assessment of nitrogen interactions Pierre CELLIER, Albert BLEEKER, Eva BØGH, Lutz BREUER, Nicolas BRUEGGEMANN, Tommy DALGAARD, Ulrike DRAGOSITS, Jean-Louis DROUET, Patrick DURAND, Enzo MAGLIULO, Jørgen OLESEN Lech RYSZKOWSKI, Mark THEOBALD, Mark SUTTON INRA (F), ECN (NL), Univ. Roskilde (DK), Univ. Giessen (D), IMK-IFU (D), DIAS (DK), CEH (UK), RCAFE (PL) Open Science Conference on the GHG Cycle in the Northern Hemisphere, Sissi-Lassithi, Crete, 14th-17th November 2006
How can be seen a landscape with a nitrogen perspective? A patchwork of sources and sinks of N in the natural (fields, forests, natural ecosystems) and « man-made » environments (building, villages, roads) (both largely determined by human activities in the past and present) with a significant fraction of sources and sinks managed by man and possible mitigation on both. Special focus on rural landscapes where large amounts of N are manipulated agricultural areas with livestock, pigs, poultry, … What are the interactions between these sources and sinks, and the consequences on N2O fluxes? Courtesy J.E. Olesen ?? Open Science Conference on the GHG Cycle in the Northern Hemisphere, Sissi-Lassithi, Crete, 14th-17th November 2006
What happens to reactive nitrogen emitted to the atmosphere and the soil in such areas? Open Science Conference on the GHG Cycle in the Northern Hemisphere, Sissi-Lassithi, Crete, 14th-17th November 2006
L = 15 m z (m) 10 10 10 Using a lagrangian-stochastic model (MODDAS-2D, Loubet et al., 2006) to estimate NH3 deposition and concentration field close to a source (animal housing) surrounded by a tree belt of different widths 2.1% L = 30 m 0 0 0 z (m) L 10 4.6% Animal housing Tree Belt L = 70 m z (m) z (m) 7.1% 0 0 70 x (m) 0 10 20 30 40 50 60 70 x (m) Local recapture of ammonia by tree-belts close to a source B. Loubet et al. (collab INRA / CEH) Open Science Conference on the GHG Cycle in the Northern Hemisphere, Sissi-Lassithi, Crete, 14th-17th November 2006
NORTH 100 80 Deposition Kg N ha-1 y-1 60 EAST 240-280 WEST 40 Distance to the farm (m) 200-240 20 160-200 120-160 0 FARM 80-120 -20 40-80 -40 0-40 -60 0 60 20 40 80 -60 -40 -20 100 Distance to the farm (m) from Fowler et al. (1998) SOUTH Ammonia deposition can induce large input to neighbour ecosystems from Fowler et al. (1998) • are there N2O emissions induced by these hot-spots of NH3 deposition? Open Science Conference on the GHG Cycle in the Northern Hemisphere, Sissi-Lassithi, Crete, 14th-17th November 2006
8 7 6 5 4 3 2 1 0 S3 1 2 S1 3 4 5 6 7 8 8 7 6 5 4 3 2 1 S4 0 1 2 S1 3 4 5 6 7 8 8 7 6 5 4 3 2 1 0 S3 1 2 S1 3 4 5 6 7 8 Atmospheric deposition from « source » to « sink » fields wind Deposition = 6.4% of the emissions wind Deposition = 3.4% of the emissions wind Deposition = 8.2% of the emissions Bare soil where slurry has been applied large ammonia emission Grassland with LAI = 2 Open Science Conference on the GHG Cycle in the Northern Hemisphere, Sissi-Lassithi, Crete, 14th-17th November 2006
N2O emission Nitrate recapture by crops Nitrate transfer and N2O emissions at catchment scale in shallow groundwater systems Nitrate leaching Denitrification Nitrate transfer Open Science Conference on the GHG Cycle in the Northern Hemisphere, Sissi-Lassithi, Crete, 14th-17th November 2006
Distributed denitrification Distributed N concentration in groundwater Consequence of hydrological transfer on N2O emission at catchment scale Soil-groundwater interaction zone TNT2 Model from Patrick Durand, INRA Rennes Open Science Conference on the GHG Cycle in the Northern Hemisphere, Sissi-Lassithi, Crete, 14th-17th November 2006
Transfer of nitrogen by the atmosphere and the hydrology can create delocalized hot-spots of N2O emission (indirect emission) at local scale, and modify the GHG balance atlandscape scale. This is sensitive to the arrangement of landscape elements (farm, vegetation, humid zones, …) Open Science Conference on the GHG Cycle in the Northern Hemisphere, Sissi-Lassithi, Crete, 14th-17th November 2006
Nitrous Oxide (N2O) Nitrogen oxides (NOx) Ammonium nitrate in rain (NH4NO3) Further emission of NOx & N2O carrying on the cascade Ammonia (NH3) Livestock farming Natural ecosystems Leached Nitrate (NO3-) Nitrate in streamwaters Atmospheric N2fixed to reactive nitrogen (NR) The Nitrogen Cascade NR Fertilizer manufacture NR Crops for food & animal feed Open Science Conference on the GHG Cycle in the Northern Hemisphere, Sissi-Lassithi, Crete, 14th-17th November 2006
Accounting of all emissions (housing, field work, transport, indirect, …) N and C flows consistency N/C allocation to fields (amount+timing) Estimate at farm scale (see e.g. GreenGrass results) … Link with management Link with mitigation options Moreover, the farm is a part of the landscape Accounting for the farm dimension allows to ensure … Open Science Conference on the GHG Cycle in the Northern Hemisphere, Sissi-Lassithi, Crete, 14th-17th November 2006
Nitrous oxide emissions: 7933 kg CO2-eq/ha/yr Nitrogen flows on a mixed cattle farm(FASSET model, DIAS, DK) Manure store Import of feed+straw 104 76 Animals 10 39 N2 94 129 Sale of milk+meat 59 Crop Above-ground Below-ground NH3 51 Sale of plant prod. 11(+11) 85 105 238 13 Import of fertiliser 116 64 Soil 74 6 <1 76 <1 N2O 2 NO3 Open Science Conference on the GHG Cycle in the Northern Hemisphere, Sissi-Lassithi, Crete, 14th-17th November 2006
Two examples of output from a farm model Emissions per kg milk produced Emissions per component Pre- chain Animal House Manure Field Integrate all components at farm scale Allows to compare farming system on farm scale basis (FASSET model, DIAS, DK) Open Science Conference on the GHG Cycle in the Northern Hemisphere, Sissi-Lassithi, Crete, 14th-17th November 2006
Calves Calves Organization of farm activity in space: example of an INRA experimental farm Heifers Dairy cows night pasture Hay from Jean-Louis FIORELLI INRA Mirecourt FARM grassland cropland Steers Dairy cows day pasture Heifers Heifers N used at farm scale is not disposed randomly nor uniformly to land • need to consider spatial interactions Hay + slurry/manure management + hay / silage management Open Science Conference on the GHG Cycle in the Northern Hemisphere, Sissi-Lassithi, Crete, 14th-17th November 2006
A ± common scale to all « processes » 1 km 100 m 100 m – 1 km typical scale of 100-101 km² Open Science Conference on the GHG Cycle in the Northern Hemisphere, Sissi-Lassithi, Crete, 14th-17th November 2006
The biophysical model (ecosystem/atmosphere /hydrology) needs a farm model to allocate N and C to field ensure consistency at farm/regional scale link with decision making The farm model needs a biophysical model to improve emission estimates at field account for the characteristics of the environment Need decision rules to allocate N in space Need for a coupled model Open Science Conference on the GHG Cycle in the Northern Hemisphere, Sissi-Lassithi, Crete, 14th-17th November 2006
The landscape scale in NitroEurope: developmentof the NitroScape model Landscape database • Choosing the relevant models : • atmospheric • hydrological • ecosystem • farm • (in a consistent way) GIS Open Science Conference on the GHG Cycle in the Northern Hemisphere, Sissi-Lassithi, Crete, 14th-17th November 2006
Database(input data) Model C Model A Database(input data) Model A Wrapper Calls models& database, Provides input from & collects output to DB at iterations Database(input data) Model C = A+B Model A Model B Model B Model B Concepts of model linking Model C Re-coding Linked models (1) Linked models (2) (OpenMI, Palm, MCT, …) Open Science Conference on the GHG Cycle in the Northern Hemisphere, Sissi-Lassithi, Crete, 14th-17th November 2006
NEU-C4 : establishing a network of landscape sites Leadburn Bjerringbro Turew Vel Vanla Naizin • Different climatic conditions • Different farming systems • High N inputs but ≠ levels • Mixing of fields/farms and natural ecosystems deposition • Landscape size : ≈ 5 km x 5 km • Local involvement of farmers Piana del Sele Open Science Conference on the GHG Cycle in the Northern Hemisphere, Sissi-Lassithi, Crete, 14th-17th November 2006
Complexity of the environment and possible interactions between, physical, biological and human « environments » Scale of management/decision making,of application for abatement options Need for understanding basic processes and interactions at this scale and interactions between natural environment and processes and decision-making Help to account for the environment in N management and mitigation options Helpfull to upscale from farm/field emission to regional scale, and make balances at landscape and farm scale Summary:landscape scale analysis must be made in the context of nitrogen research because: Open Science Conference on the GHG Cycle in the Northern Hemisphere, Sissi-Lassithi, Crete, 14th-17th November 2006