Download

1 / 27
450 likes | 1.32k Vues
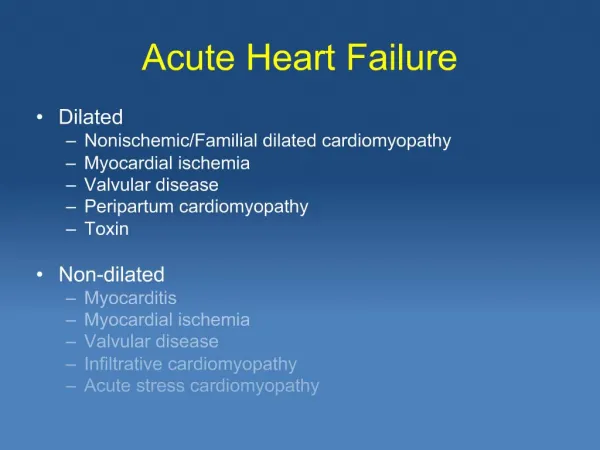
Acute Right Heart Failure. Goals. What is the role of the RV ventricle in cardiovascular physiology How does the RV’s anatomy help it accomplish this role. How does the RV’s anatomy contribute to the pathophysiology of Acute Right Heart Failure

E N D
Goals • What is the role of the RV ventricle in cardiovascular physiology • How does the RV’s anatomy help it accomplish this role. • How does the RV’s anatomy contribute to the pathophysiology of Acute Right Heart Failure • How can we use this knowledge to develop appropriate management strategies?
Venous Return Physiology • “Most People have a Cardiocentric view of the World.” – Michael O’Conner • The Heart can only pump out, what comes in. Therefore the main job of the RV is to maintain a low right atrial pressure so that Venous Return is optimized.
Determinants of Venous Return Mean systemic filling pressure Right Atrial Pressure Resistance to Flow Pressure change is slight. Thus, small increase in RA Pressure causes dramatic reduction in venous return. (mean systemic filling pressure).
Venous Return Curves Plateau: collapse of large veins ( => increased resistance) Venous return with volume loading Cardiac Output with increase inotropy 5 L/min VR (CO) Working Cardiac Output 0 -4 Mean systemic filling pressure ~ 7 mm Hg Rt. Atrial Pressure (mm Hg)
Frank-Starling Law of the Heart • States that strength of ventricular contraction varies directly with EDV • Is an intrinsicproperty of myocardium • As EDV increases, myocardium is stretched more, causing greater contraction & SV Fig 14.2
Anatomy • The RV is triangular in shape • Divided into three regions; • Inlet • Apex • Infundibulum or Conus • Both Ventricles are composed of a 3D network of muscle fibers Circulation 2008;117:1436-1448
Effect of Ventricular Contraction • Right ventricular Contraction is sequential, starting with the inlet and ending at the infundibulum. • Inward movement of the free wall (bellows effect) • Contraction of the longitudinal fibers, which shortens the long axis. • Traction of the free wall caused by contraction of the LV. (wringing effect) • Due to the compliance of the infundibulum the peak pressure is reduced and prolonged. • This leads to near complete emptying of the RV>>reduced RVEDP>>Optimal Venous return.
Effect of Ventricluar Afterload • As a result of the lower pulmonary circuit pressures the period of Isovolumic contraction is less compared to the LV (or Pressure loaded RV). This results in decreased Myocardial oxygen demand. • Additionally the point of semilunar valve closure is delayed leading to a prolonged ejection phase. Intensive Care Med. 2004; 30: 185-196
While on the Topic of Oxygen Delivery… • Right Ventricular Perfusion • In a right dominant system; • Lateral Wall- Marginal branches of RCA • Posterior and Inferoseptal- PDA • Anterior and Anteroseptal- Branches of LAD • RCA is relatively resistant to ischemia compared to the LV. • Lower oxygen consumption • More extensive collateral system • The ability to increase its O2 extraction during increase demand. • Normally proximal RCA flow occurs in both diastole and Systole. Unlike LCA flow to the LV. This is secondary to the transmural pressure generated during systole.
Diagnosis: Nonspecific Findings Chest. 2005;128:1836-1852
CVP and Arterial Line • Calculation of Fick CO: • CO(L/min)=VO2/[(13.4*HgB)*(SaO2-SvO2)] • Correlates well with thermodilution at low CO <5L/min, larger variation at higher CO’s • In setting acute RHF the response to a small initial fluid bolus of 250cc can be informative. • A rise in CVP without a concaminant rise in CO may indicate when further volume would be detrimental. Critical Care 2003;7:171-178
Etiologies of RV Failure Chest. 2005;128:1836-1852
Management • Treat the underlying cause if possible • Fluid Management • Volume Loading or Diuresis? • Maximize Myocardial O2 Supply/Demand • Supplemental Oxygen • Maintaining Systemic Pressures • Norepinephrine • Phenylephrine • Avoiding Tachycardia • Blood transfusion? • Increasing Contractility • Dobutamine • Milrinone • Calcium Sensitizers • RV Afterload Reduction • Milrinone • Nitric Oxide • IV Prostacyclin • Avoid Mechanical Ventilation if possible
Fluid Management • Controversial topic • Do you volume load or avoid additional volume? • What is the evidence for each argument? • Is there are middle ground?
Table 1 Hemodynamic effects of fluid loading in acute massive pulmonary embolism. Mercat, Alain; Diehl, Jean-Luc; Meyer, Guy; Teboul, Jean-Louis; MD, PhD; Sors, Herve Critical Care Medicine. 27(3):540-544, March 1999. Table 1 . Patients' characteristics © 1999 Lippincott Williams & Wilkins, Inc. Published by Lippincott Williams & Wilkins, Inc. 2
Table 2 Hemodynamic effects of fluid loading in acute massive pulmonary embolism. Mercat, Alain; Diehl, Jean-Luc; Meyer, Guy; Teboul, Jean-Louis; MD, PhD; Sors, Herve Critical Care Medicine. 27(3):540-544, March 1999. Table 2 . Hemodynamic parameters (mean +/- SEM) recorded at baseline and after infusions of 250 mL (FL 250) and 500 mL (FL 500) of dextran-40 in 13 patients with acute massive pulmonary embolism © 1999 Lippincott Williams & Wilkins, Inc. Published by Lippincott Williams & Wilkins, Inc. 3
Figure 1 Hemodynamic effects of fluid loading in acute massive pulmonary embolism. Mercat, Alain; Diehl, Jean-Luc; Meyer, Guy; Teboul, Jean-Louis; MD, PhD; Sors, Herve Critical Care Medicine. 27(3):540-544, March 1999. Figure 1 . Individual values of cardiac index at baseline and after infusion of 500 mL of dextran 40 over 20 mins (FL 500) in 13 patients free of previous cardiopulmonary disease with acute circulatory failure caused by acute massive pulmonary embolism. © 1999 Lippincott Williams & Wilkins, Inc. Published by Lippincott Williams & Wilkins, Inc. 4
Figure 2 Hemodynamic effects of fluid loading in acute massive pulmonary embolism. Mercat, Alain; Diehl, Jean-Luc; Meyer, Guy; Teboul, Jean-Louis; MD, PhD; Sors, Herve Critical Care Medicine. 27(3):540-544, March 1999. Figure 2 . Relationship between baseline value of right ventricular end-diastolic volume index (baseline RVEDVI) measured by the means of a fast response thermistor pulmonary arterial catheter and the increase in cardiac index induced by fluid loading (500 mL of dextran 40 over 20 mins) (Delta CI) in eight patients with acute circulatory failure caused by acute massive pulmonary embolism (r = -.89, p < .05; Spearman's rank correlation test). © 1999 Lippincott Williams & Wilkins, Inc. Published by Lippincott Williams & Wilkins, Inc. 5
Figure 3 Hemodynamic effects of fluid loading in acute massive pulmonary embolism. Mercat, Alain; Diehl, Jean-Luc; Meyer, Guy; Teboul, Jean-Louis; MD, PhD; Sors, Herve Critical Care Medicine. 27(3):540-544, March 1999. Figure 3 . Relationship between baseline value of right atrial pressure (baseline RAP) and the variation in cardiac index induced by fluid loading (500 mL of dextran 40 over 20 mins) (Delta CI) in 13 patients with acute circulatory failure caused by acute massive pulmonary embolism. © 1999 Lippincott Williams & Wilkins, Inc. Published by Lippincott Williams & Wilkins, Inc. 6
Mechanical Ventilation • Higher transpulmonary pressures increase RV afterload. • Increased airway pressures reduce venous return. • Increased pleural pressures are transmitted to the pericardium and limits the diastolic filling of the RV. Chest. 2005;128:1836-1852